NPS Scores Explained Growth+This feature requires the Growth+ plan or higher
Net Promoter Score (NPS) is one of the most widely used metrics for measuring customer loyalty. EquipDash calculates your NPS automatically from survey responses, tracks it over time, and helps you act on the results.
What Is NPS?
NPS is based on a single question: "How likely are you to recommend us to a friend or colleague?" Customers answer on a scale of 0 to 10.
Based on their answer, each customer falls into one of three categories:
| Score | Category | Meaning |
|---|---|---|
| 9 - 10 | Promoter | Loyal enthusiasts who will keep coming back and refer others |
| 7 - 8 | Passive | Satisfied but not enthusiastic — could be swayed by a competitor |
| 0 - 6 | Detractor | Unhappy customers who may discourage others from using your business |
How NPS Is Calculated
The formula is straightforward:
NPS = % Promoters - % Detractors
For example, if you have 100 responses:
- 60 Promoters (60%)
- 25 Passives (25%)
- 15 Detractors (15%)
Your NPS would be: 60% - 15% = +45
Note that Passives are counted in the total but do not directly affect the score. They matter because converting them to Promoters is often the easiest way to improve your NPS.
NPS Score Ranges
NPS ranges from -100 (every customer is a Detractor) to +100 (every customer is a Promoter).
| Score Range | Rating | What It Means |
|---|---|---|
| 70 to 100 | World-class | You are delivering exceptional experiences. Keep it up. |
| 50 to 69 | Excellent | Customers love what you do. Look for small improvements to push even higher. |
| 0 to 49 | Good | Solid foundation, but there is clear room to improve. Focus on reducing detractors. |
| -100 to -1 | Needs work | More customers are unhappy than happy. Prioritise understanding and fixing the root causes. |
EquipDash color-codes your NPS score throughout the analytics page:
- Green for scores of 50 and above
- Yellow for scores between 0 and 49
- Red for scores below 0
Where to Find Your NPS in EquipDash
Your NPS score appears in several places:
- Surveys list — Each survey shows its current NPS score as a colored circle badge in the table.
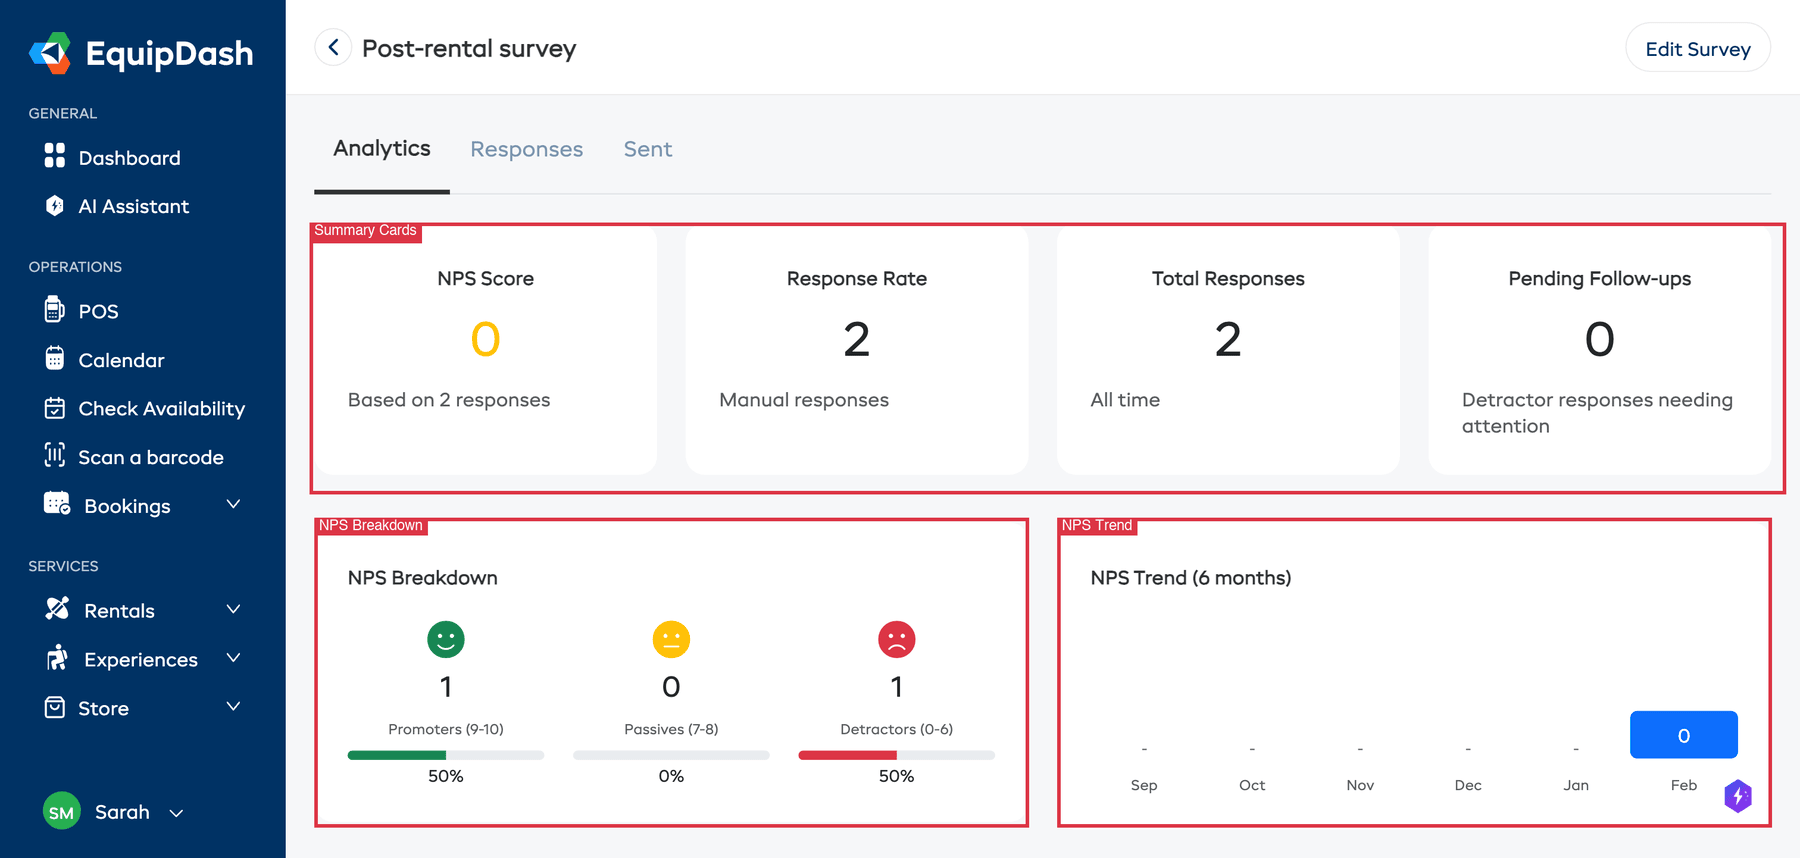
- Analytics tab — The NPS Score summary card at the top of the survey analytics page shows the score prominently.
- NPS Breakdown — Below the summary cards, the NPS Breakdown section shows the Promoter/Passive/Detractor distribution with emoji faces and percentages.
- NPS Trend chart — The NPS Trend (6 months) line chart shows how your NPS has changed over time with monthly data points.
Understanding the Promoter/Passive/Detractor Breakdown
The breakdown gives you more context than the score alone:
- High Promoter % — Your fans are vocal. Encourage them to leave public reviews.
- High Passive % — You have a big opportunity. These customers are close to becoming Promoters with just a small improvement.
- High Detractor % — There is a specific issue driving dissatisfaction. Look at open-ended responses for clues.
How to Improve Your NPS
1. Follow Up with Detractors
The single most impactful thing you can do is reach out to unhappy customers.
- Go to the Responses tab on your survey analytics page.
- Filter by NPS Category > Detractor.
- Read their feedback and click the edit icon (pencil) in the Actions column to open the Update Follow-up panel.
- Set the status to Pending and add notes about your planned outreach.
- A simple phone call or email acknowledging the issue goes a long way.
2. Read Open-Ended Feedback
Numbers tell you there is a problem. Text responses tell you what the problem is. Look for recurring themes in your Long Text or Short Text question responses.
3. Convert Passives to Promoters
Passives (7-8) are your lowest-hanging fruit. They already like you. Small improvements like faster check-in, cleaner equipment, or a friendlier greeting can push them to a 9 or 10.
4. Encourage Promoters to Spread the Word
When a customer scores you 9 or 10, EquipDash can automatically show them links to leave a review on Google, TripAdvisor, Facebook, or Yelp. Set up your Review Routing URLs in the survey settings to take advantage of this — see Creating a Survey for details on configuring review URLs.
5. Track Your Trend
A single NPS score is a snapshot. What matters is the direction. Check the NPS Trend (6 months) chart monthly and look for:
- Upward trends — Your improvements are working
- Downward trends — Something has changed. Investigate recent feedback
- Seasonal dips — Busy periods can strain service quality. Plan ahead
6. Act on Specific Questions
If your survey includes multiple rating questions, compare them. A strong overall NPS but a low score on "equipment condition" points you straight to the issue.
NPS Benchmarks for Rental and Activity Businesses
There is no universal "good" NPS because it varies by industry. For outdoor recreation, rental, and tourism businesses:
| Benchmark | Typical Score |
|---|---|
| Industry average | 30-40 |
| Good | 50+ |
| Excellent | 70+ |
Do not obsess over comparing yourself to other businesses. Your own trend over time is the most meaningful metric.