Survey Analytics & Reports Growth+This feature requires the Growth+ plan or higher
Every survey has its own results page: how happy your customers are, how many replied, what they said question by question, how many clicked through to leave you a review, and who is still waiting to hear back from you.
Opening a Survey's Results
- Click Surveys in the left sidebar.
- Click the survey's name, or the View analytics (chart) icon on its row.
- You land on the Analytics tab.
The Page Header
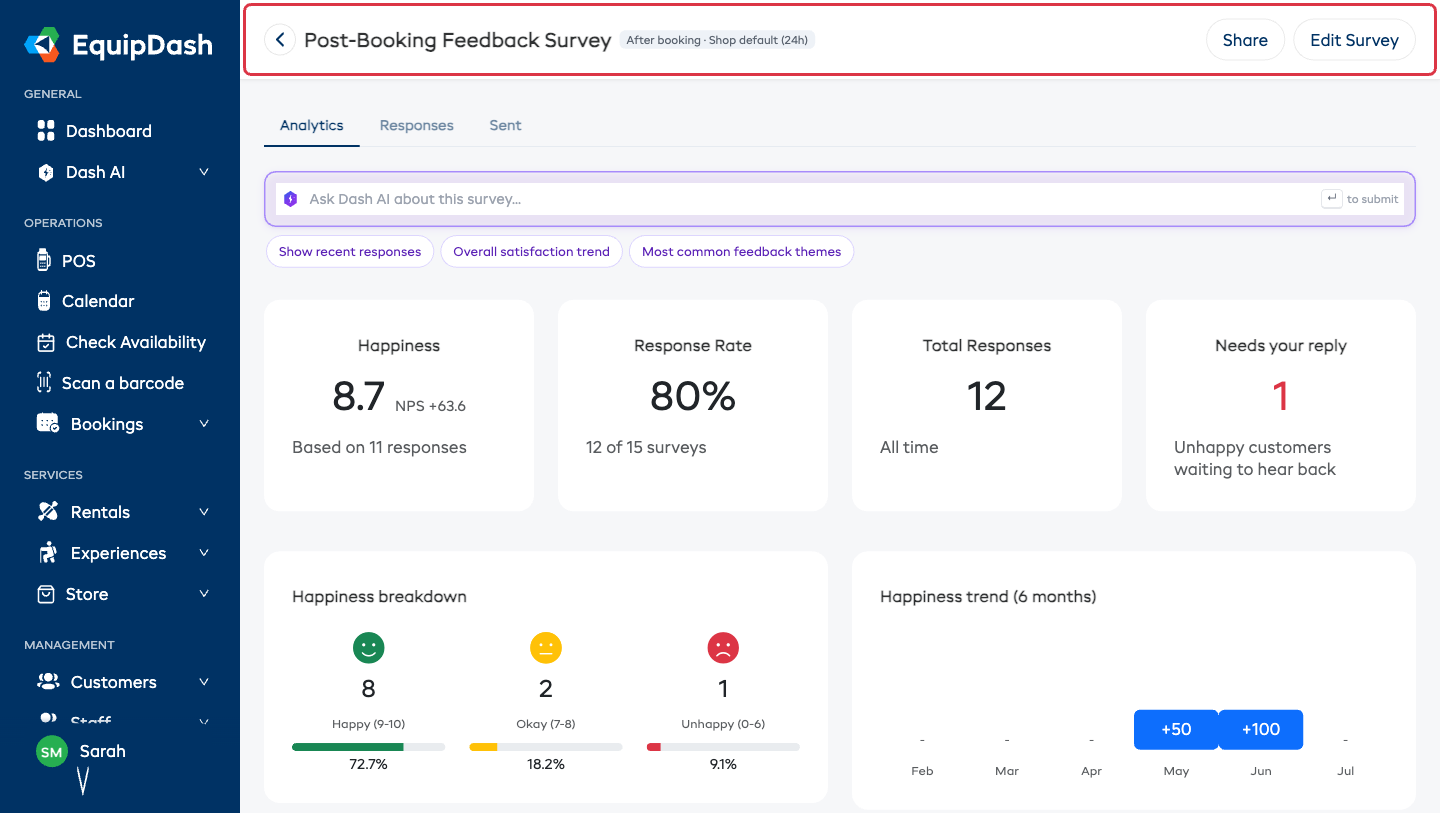
- Survey name, with a back arrow to the surveys list.
- A delivery summary badge — the same one-liner as the builder's Delivery card ("After booking · 2 hours"), so you can see when this survey sends without leaving the results. It's read-only here; change it in the builder.
- Share — opens the Share Survey modal: link, website embed, QR code, and the printable counter card.
- Edit Survey — opens the builder.
- Three tabs: Analytics, Responses, Sent.
Under the tabs, the Ask Dash AI about this survey bar lets you ask questions in plain words — "show recent responses", "what are the most common themes".
The Analytics Tab
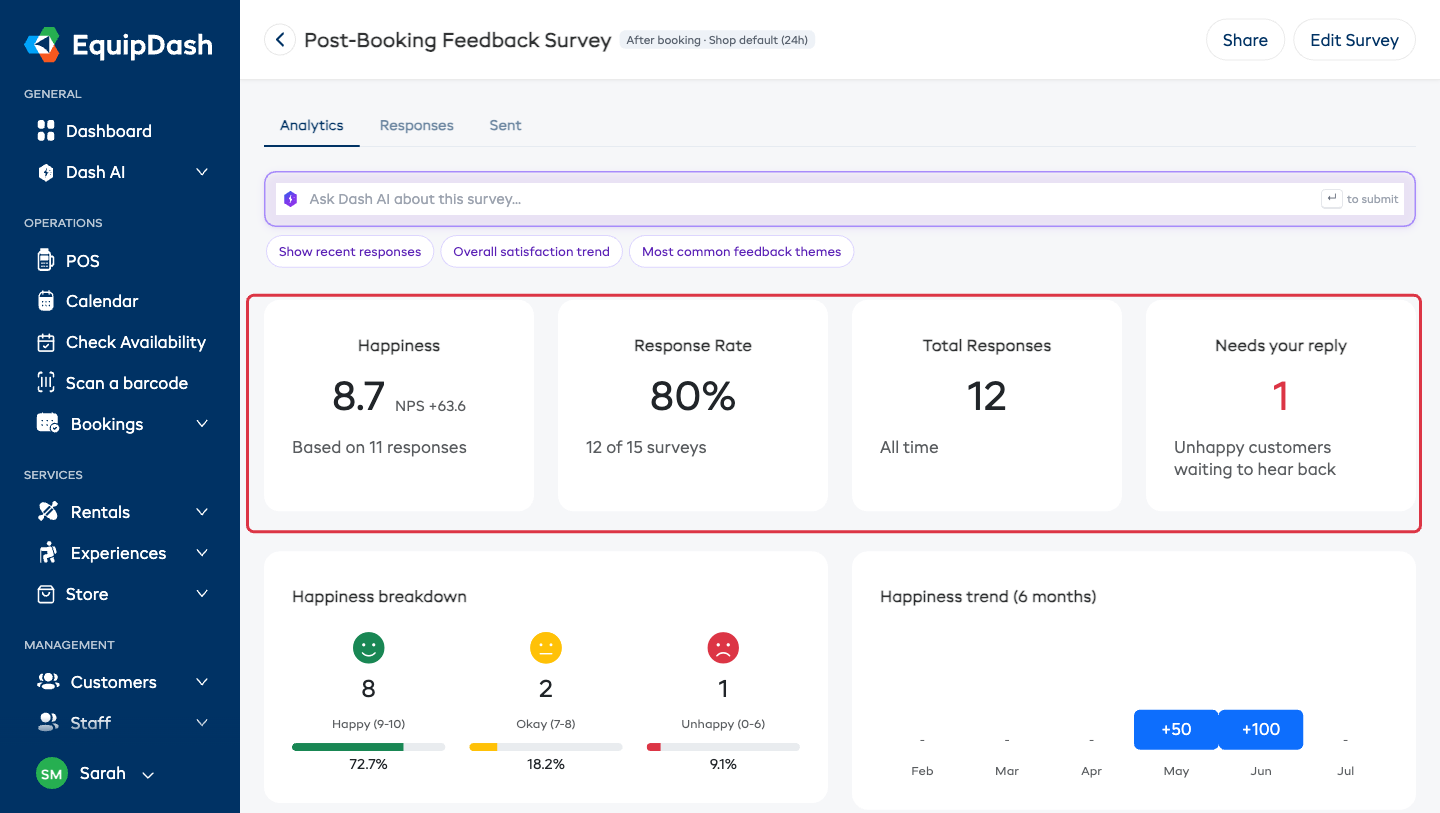
Summary cards
| Card | What it shows |
|---|---|
| Happiness | The average 0–10 rating — the simplest answer to "are my customers happy?" — with your NPS beside it for benchmarking, and how many responses it's based on. |
| Response Rate | The share of sent surveys that came back, with the counts underneath ("12 of 15 surveys"). A manual-only survey shows its response count instead. For a survey set to go to everyone on the booking, each person counts as one send — so a 20-person booking counts as 20, not 1. |
| Total Responses | Every completed response, all time. |
| Needs your reply | Unhappy customers still waiting to hear back from you. It turns red as soon as it's above zero. |
Happiness breakdown
The split of your rated responses across three groups, each with a face, a count, a bar, and a percentage:
| Group | Score | Face |
|---|---|---|
| Happy | 9–10 | Smiling |
| Okay | 7–8 | Neutral |
| Unhappy | 0–6 | Frowning |
(These are the classic NPS groups in plain words — see Happiness Scores (NPS) Explained.)
Happiness trend (6 months)
Your score month by month over the last six months. A single score is a snapshot; this is the part that actually tells you whether things are getting better.
By guide
If you run experiences with rostered guides, By guide shows the average happiness from guests on each guide's departures, with the response count behind each score. It's internal only — your team sees it, guests never do, and customers are never asked to name a guide. Use it to spot your strongest guides and the ones who could use support. The section only appears once there's guide data to show.
Review clicks
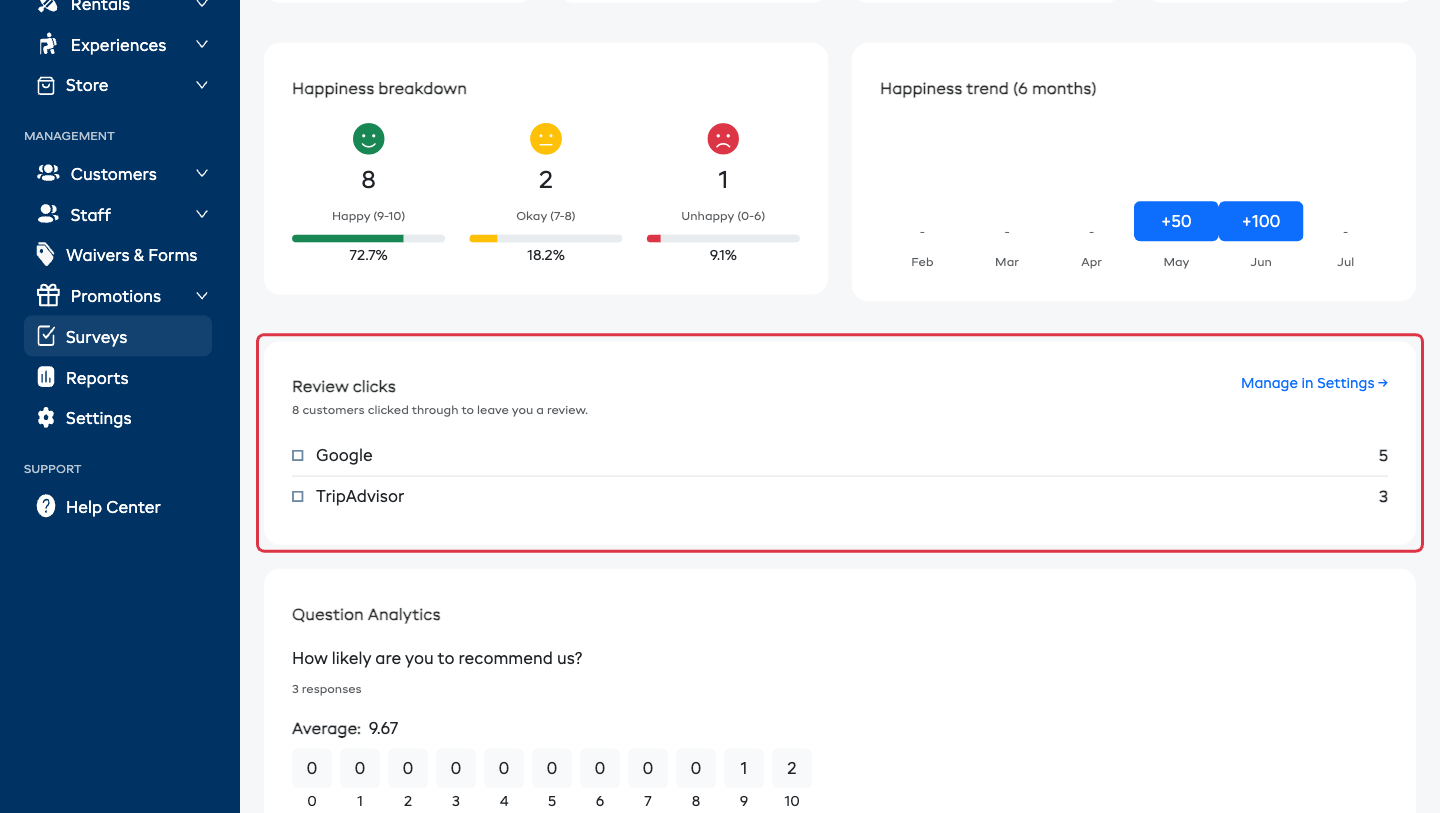
How many customers actually clicked through to leave you a review, broken down by platform (Google, TripAdvisor, and any others you've set up). Every review button on the thank-you page routes through EquipDash first, so these counts are real clicks, not guesses — then the customer lands on the review site as normal.
Manage in Settings → takes you to Settings → Surveys & reviews to add or correct your links. The card only appears once at least one review link is configured.
Check the link itself under Settings → Surveys & reviews → Your review pages — a link that goes to your listing rather than its "write a review" page loses people at the last step.
Question Analytics
Every question in the survey, with its own summary:
- Rating questions — the average plus the full distribution of scores.
- Choice questions — each option with its count and a bar.
- Text questions — the most common keywords across the answers.
A question that's only shown to some people carries a Conditional badge, and its response count reads "N% of the X who saw this question" — so a gated question never looks skipped by people who were never asked it.
The Responses Tab
Every individual response, one per row.
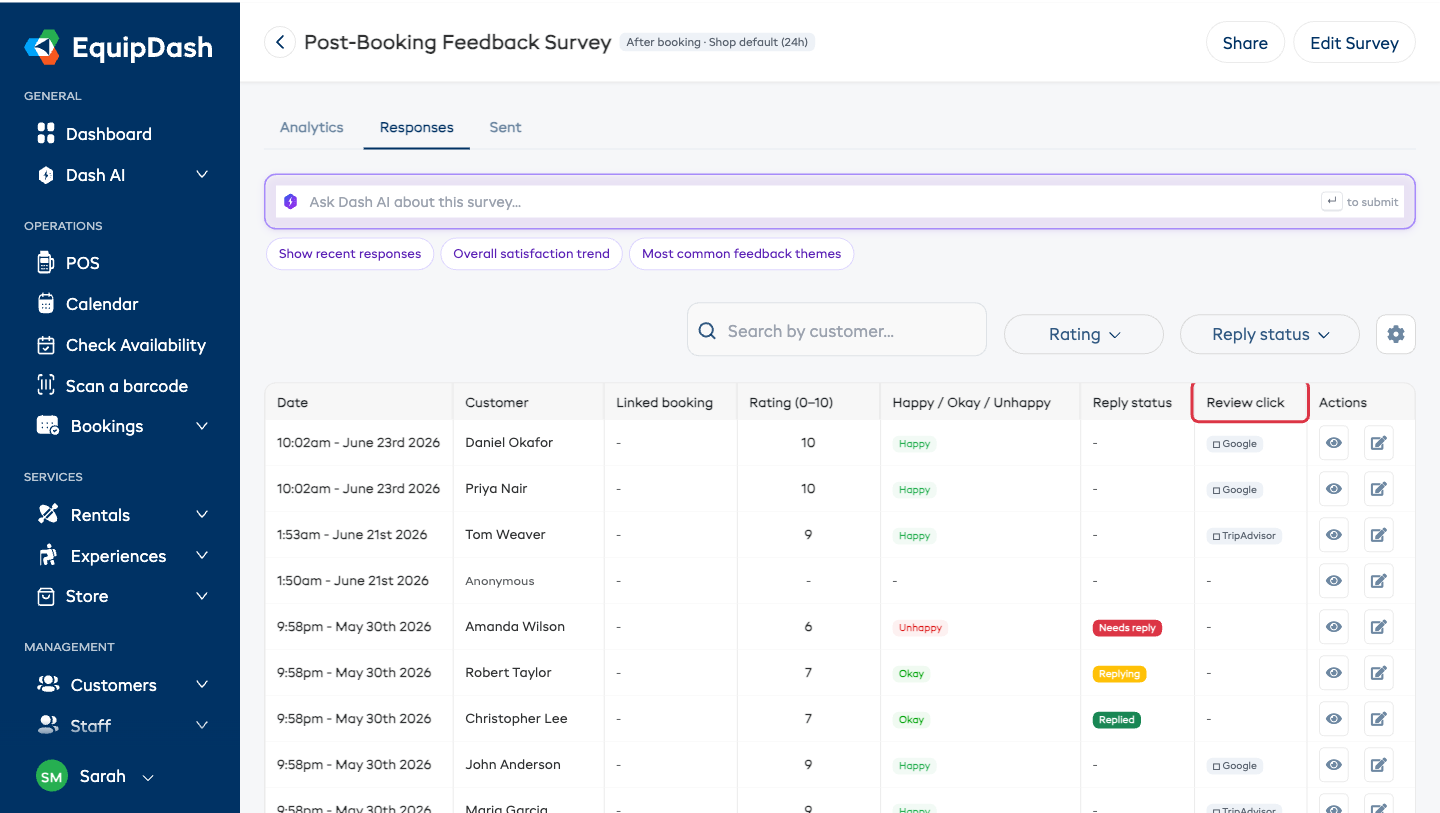
Above the table: a Search by customer box, a Rating filter (Happy / Okay / Unhappy), a Reply status filter, and the gear for columns.
| Column | What it shows |
|---|---|
| Date | When the response came in |
| Customer | Their name, linked to their customer record — or Anonymous for a shared link with no email |
| Linked booking | The booking this response belongs to |
| Rating (0–10) | The score they gave |
| Happy / Okay / Unhappy | The group that score falls into |
| Reply status | Needs reply, Replying, or Replied |
| Review click | A badge naming the platform when this customer clicked through to leave a review from the thank-you page |
| Actions | View (eye) and Follow-up (pencil) |
Three more columns are available from the gear and off by default: Customer email, Internal notes, and Replied at. Date and Actions are fixed. Your layout saves automatically and is shared with your team.
Viewing a response
Click the eye icon to open Response Details — the date, customer and booking, the rating and its group, every question with the customer's answer, and any internal notes. If the response came in through a shared link and isn't attached to anyone yet, Link Customer/Booking lets you attach it.
Following up on responses
Click the pencil icon to open Update Follow-up:
- Set Status:
| Status | Meaning |
|---|---|
| Needs reply | Someone should reach out, and nobody has yet |
| Replying | You're in the middle of sorting it out |
| Replied | Done |
- Add Internal Notes — what you did about it ("Called, apologized about the late start, gave 20% off their next booking"). Customers never see these.
- Click Save.
The Needs your reply card on the Analytics tab counts everything still in Needs reply or Replying, so nobody quietly falls through.
Turn on Email me when a customer is unhappy — on the survey's Advanced settings, or shop-wide in Settings → Surveys & reviews — and you'll hear about a low score the moment it lands, not on Monday.
Linking a response to a customer and booking
A response that came in through a public link or QR code may not be attached to anyone:
- Click the eye icon to open Response Details.
- Click Link Customer/Booking.
- Search for the Booking by number or customer name.
- The Customer is filled in from the booking — edit it if you need to.
- Click Save.
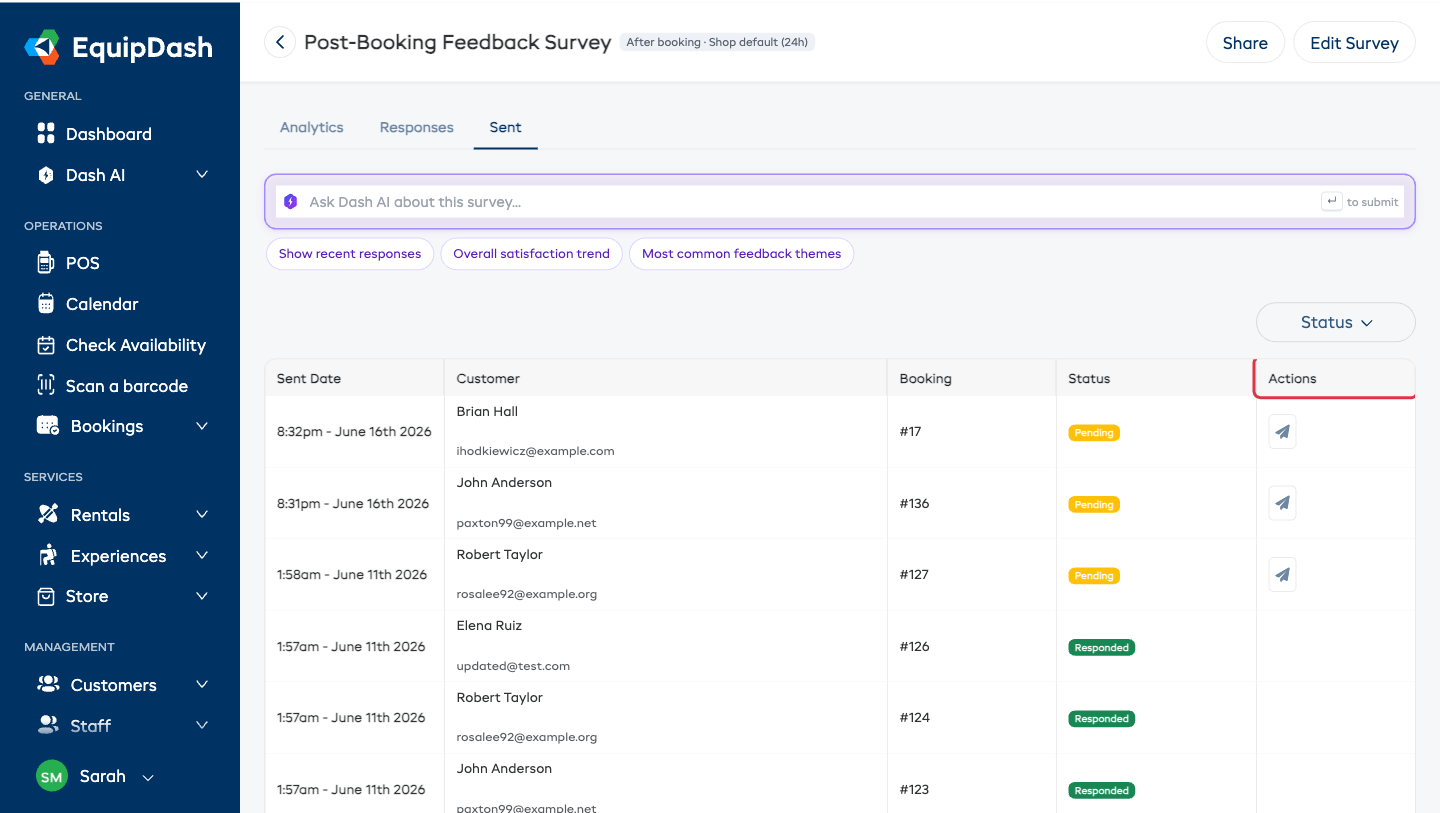
The Sent Tab
Every send for this survey, with its status and a resend action. Covered in full under Tracking What Was Sent.
Your Week in Feedback
Don't want to log in to check? Every Monday morning EquipDash emails you a plain-English summary: responses, Happiness, anything needing your reply, and review-link clicks. See Your Weekly Feedback Digest.
Getting the Most from This Page
- Read the Monday digest, and log in when it says something needs you.
- Reply to every unhappy customer. A quick call turns most of them around — and it happens before a public review gets written.
- Watch the trend, not the score. One month is noise; six months is a signal.
- Read the text answers. The numbers tell you what; the words tell you why.
- Check Review clicks against your actual review count. Lots of clicks and no new reviews usually means the link is pointing at the wrong page.