Reports Overview
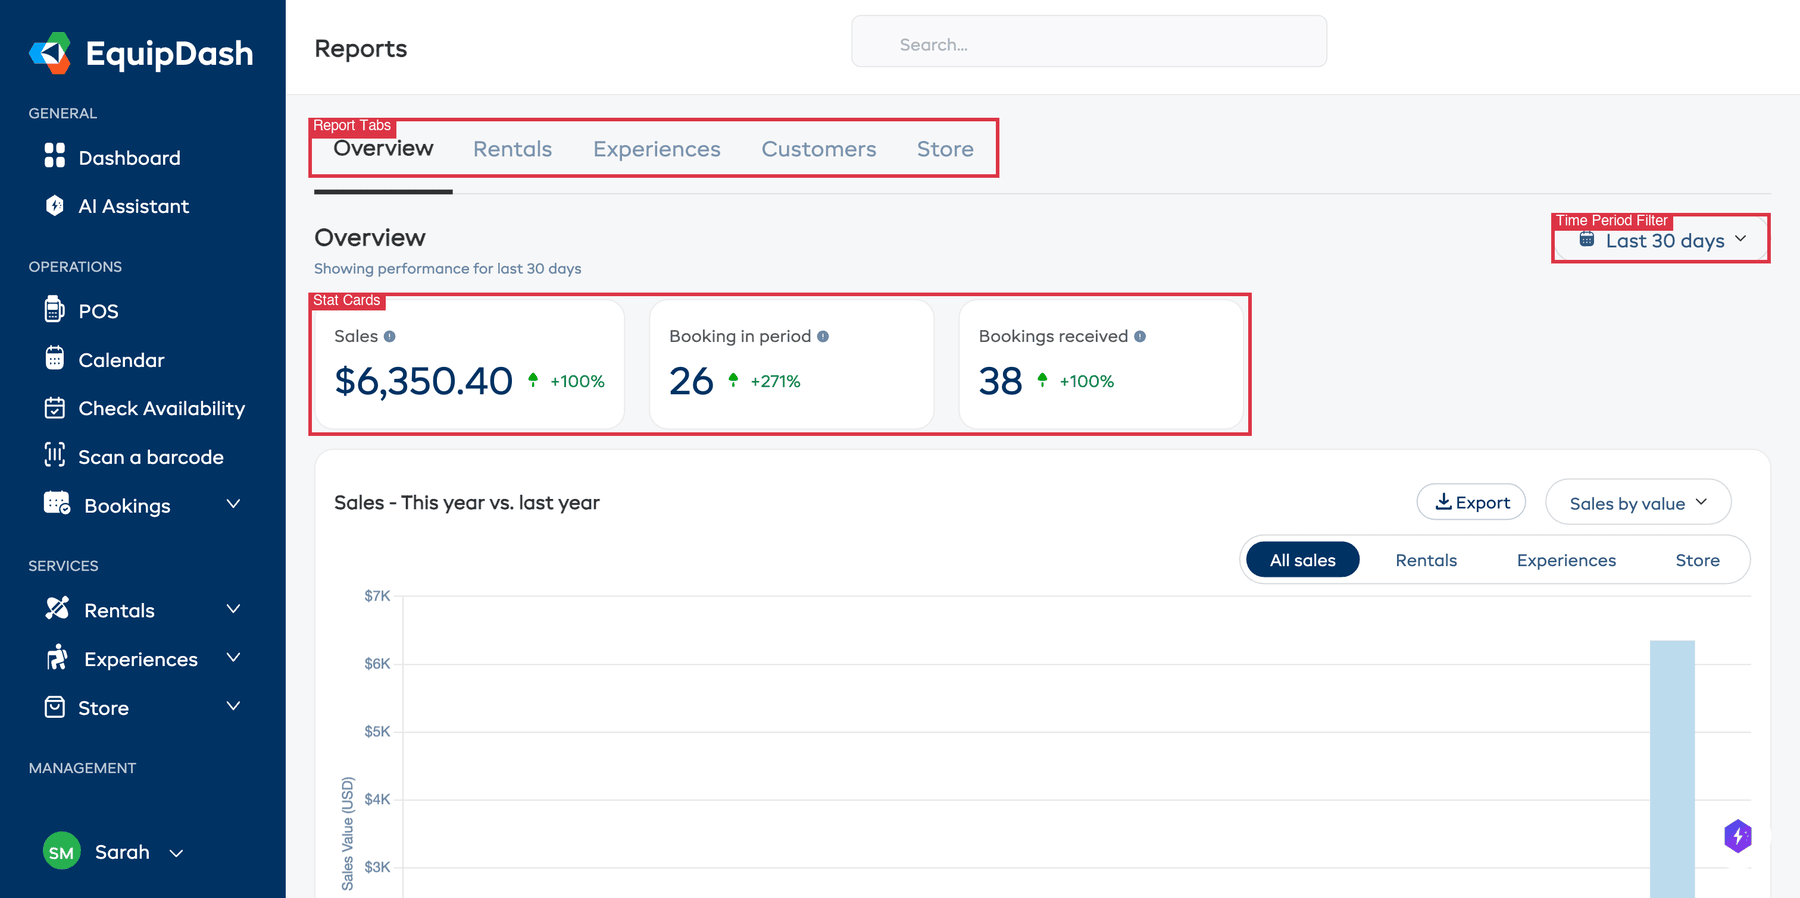
The Reports section gives you a clear picture of how your business is performing. You can track revenue, bookings, customer growth, and more — all from one page with easy-to-read charts and stat cards.
Finding the Reports Page
- Click Reports in the left sidebar.
- You will land on the Overview tab, which shows your top-level business metrics.
Report Tabs
Reports are organised into tabs across the top of the page. Click on a tab to switch between report views.
| Tab | What It Shows |
|---|---|
| Overview | Key metrics at a glance — sales, bookings, booking channels, payment methods, seasonal trends, top rentals, top experiences, and top customers |
| Rentals | Rental-specific data — sales, bookings by day and time, top categories, utilisation rate, average rental duration, and product performance |
| Experiences | Experience-specific data — sales, bookings by day, average participants, top categories, and top experiences |
| Customers | Customer growth, new vs returning customers, top customers by spend, city breakdown, and booking type split |
| Store | Store product sales, items sold, average order value, active products, and top store products |
The Rentals, Experiences, Store, and Inventory report tabs only appear when their module is enabled. See Modules.
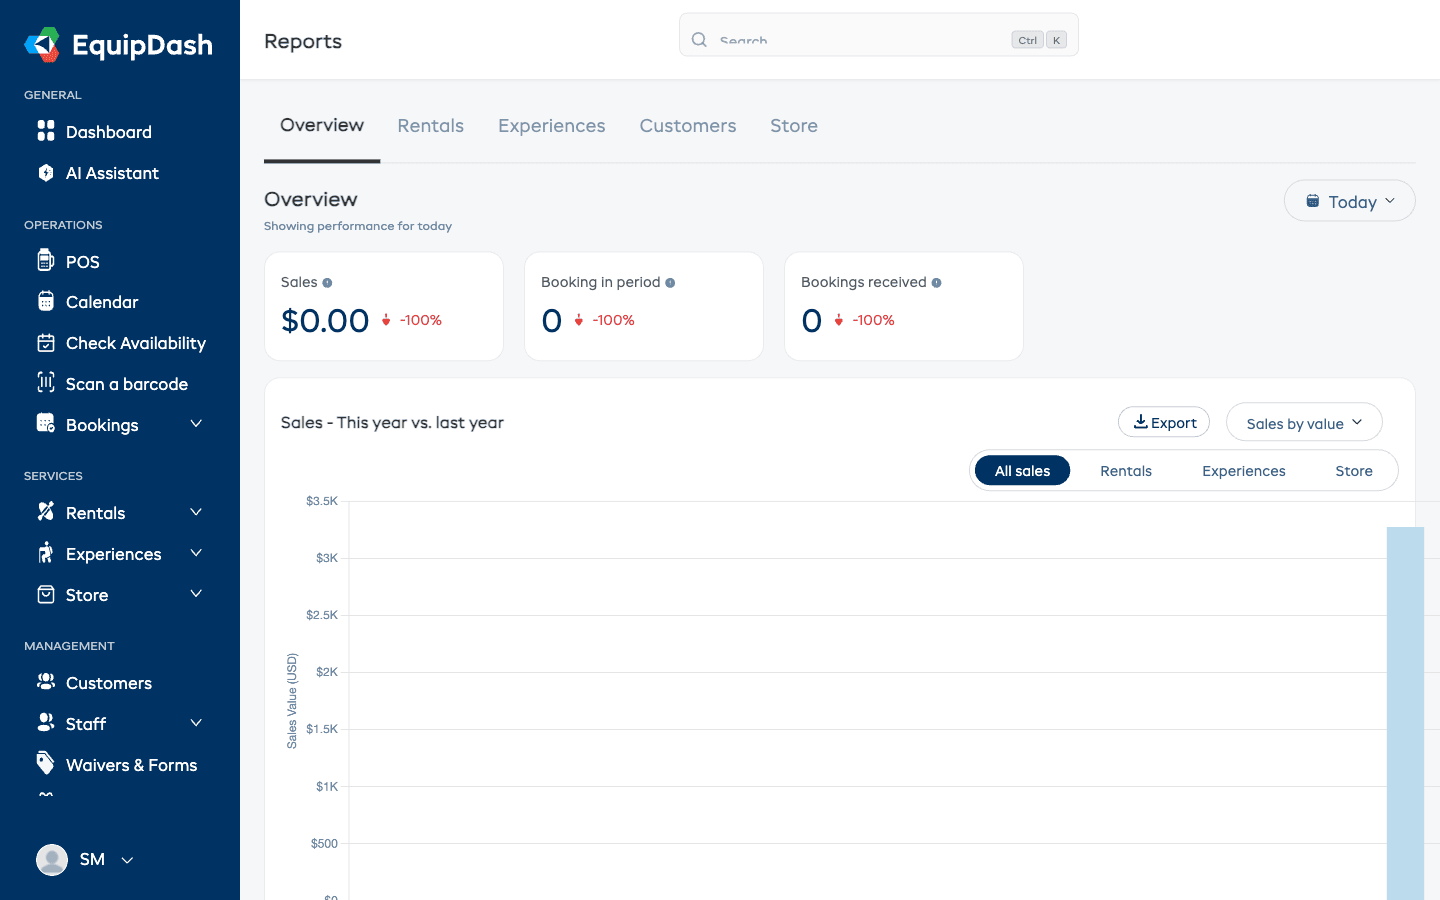
Time Period Filter
Every report tab includes a time period dropdown in the top-right corner that lets you choose which date range to view. The filter applies to all charts and stat cards on the current tab.
To change the time period:
- Click the Today dropdown button in the top-right corner of the report tab.
- Select the period you want from the dropdown menu.
- All charts and cards on the page update automatically.
Available time periods:
| Period | What It Covers |
|---|---|
| Today | Data from the current day only |
| Last 7 days | The past 7 days including today |
| Last 30 days | The past 30 days including today |

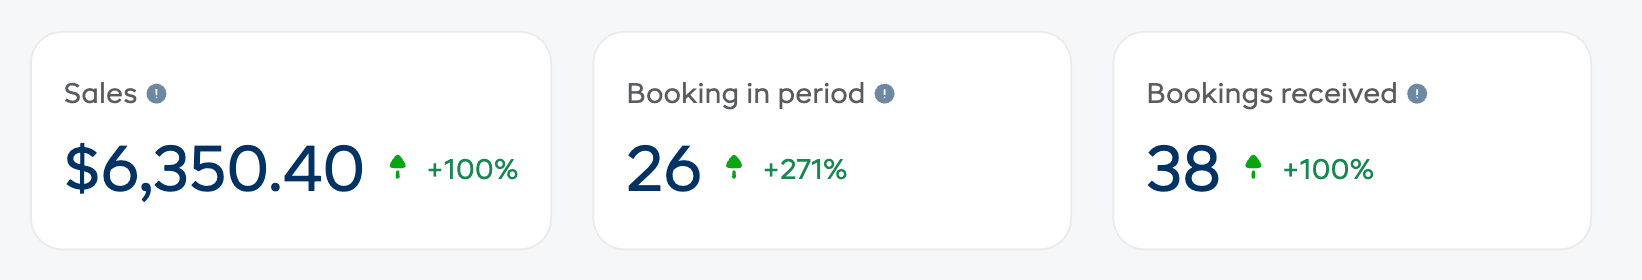
Stat Cards
The stat cards across the top show your headline numbers for the selected time period.
| Card | What It Shows |
|---|---|
| Sales | The total sales revenue received during the period |
| Booking in period | The number of bookings that fall within the selected period |
| Bookings received | The number of new bookings created during the period |
Each card shows a percentage change compared to the previous equivalent period. For example, if you are viewing "Last 7 days", the comparison is to the 7 days before that. A green indicator means the metric improved; red means it declined.
Export Buttons
Most charts and tables include an Export button that lets you download the data as a CSV file. Look for the export icon next to each chart title.
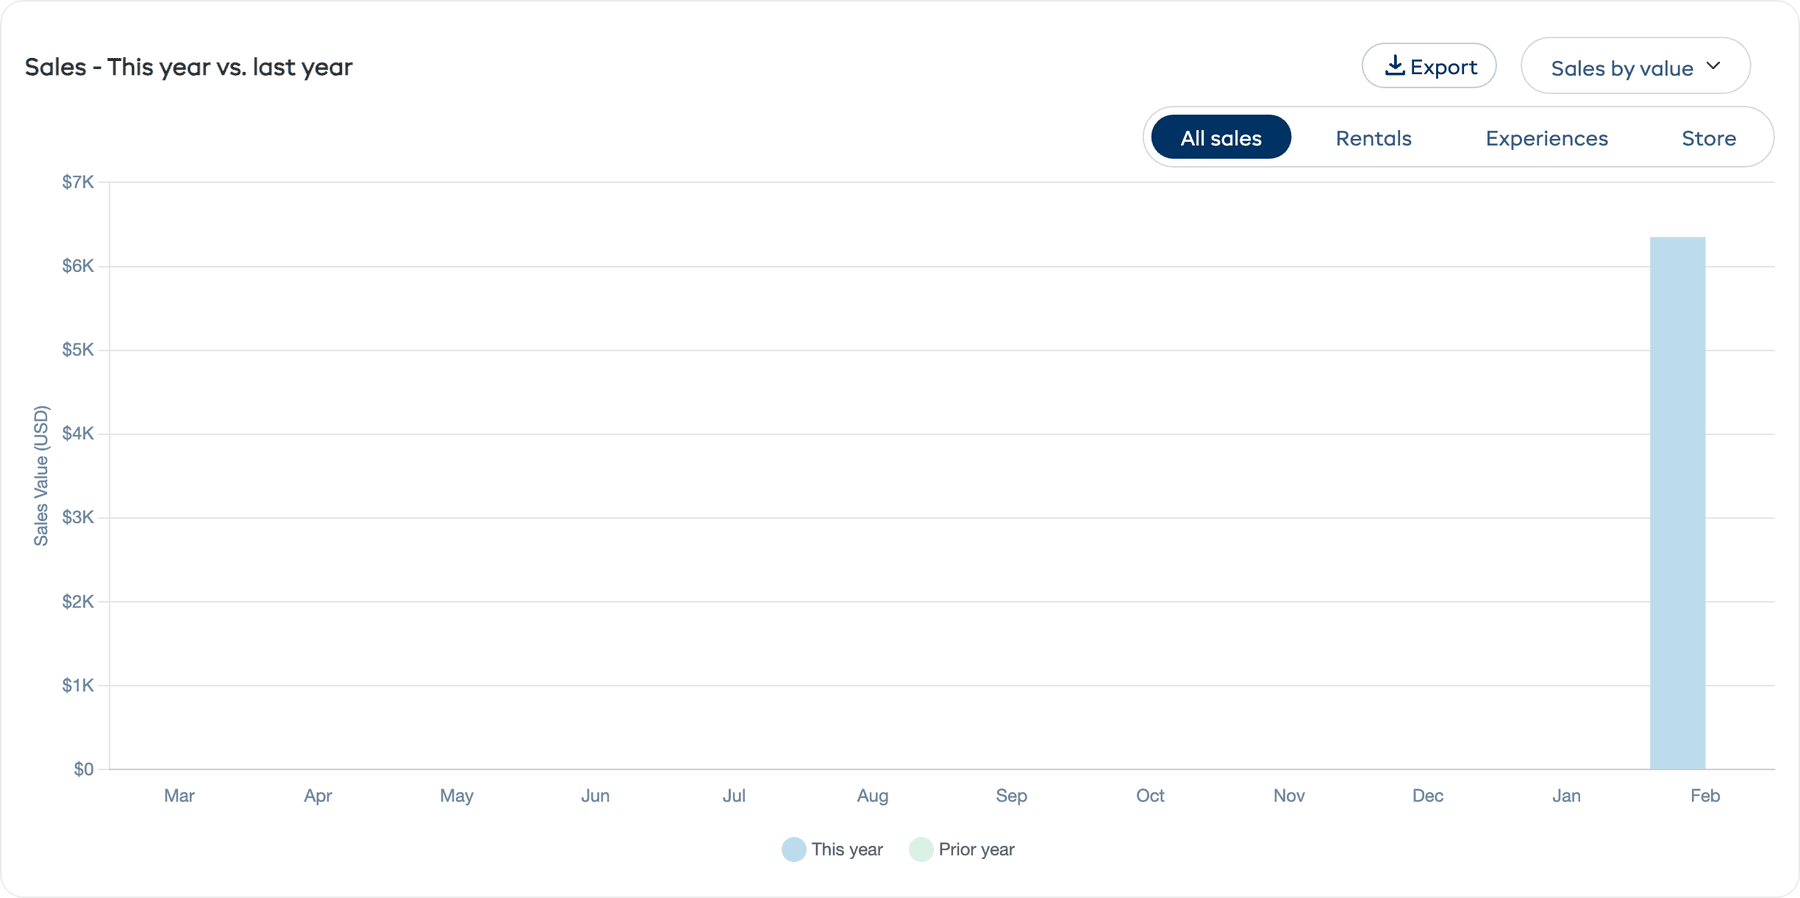
Sales — This Year vs. Last Year
The Sales - This year vs. last year chart shows your revenue compared month-by-month against the prior year. This helps you see seasonal patterns and whether your business is growing year over year.
The chart includes filter options:
- Sales by value / Sales by quantity — Switch between viewing revenue amounts or booking counts
- All sales / Rentals / Experiences / Store — Filter to a specific booking type
Booking Channel
The Booking channel chart breaks down where your bookings are coming from:
| Channel | Meaning |
|---|---|
| POS | Bookings created by staff through the Point of Sale |
| Online booking | Bookings made through your online booking widget |
This helps you understand how customers are finding and booking with you.
Customers & Participants Booked
The Customers & participants booked chart is a dual-axis chart showing two metrics over time:
- Customers booked — The number of unique customers who made bookings
- Booked participants — The total number of participants across all bookings
This helps you see whether your customer base and group sizes are growing.
Bookings by Payment Method
The Bookings by payment method chart shows which payment methods your customers are using (e.g. card, cash, bank transfer). Use this to understand your payment mix and make sure you are offering the right options.
Bookings by Season
The Bookings by season chart shows booking volume across your configured seasons (e.g. Peak Winter, Off Peak Winter, Peak Summer, Off Peak Summer). It splits the data by Rentals and Experiences so you can see seasonal demand for each service type.
You can toggle between Sales by value and Sales by quantity using the dropdown.
Top 5 Rentals and Top 5 Experiences
Two charts show your Top 5 rentals (most-booked or highest-revenue products) and Top 5 experiences (most-booked or highest-revenue activities) for the selected period. These help you quickly identify your bestsellers.
Each chart has a By value / By quantity dropdown to switch between revenue and booking count views, plus an Export button.
Top 10 Customers (by Sales)
At the bottom of the Overview tab is a Top 10 customers (by sales) table showing your highest-spending customers. The table includes:
| Column | Description |
|---|---|
| First name | Customer's first name |
| Last name | Customer's last name |
| Customer's email address | |
| # bookings | Total number of bookings |
| Total spend | Total revenue from this customer |
| Last booking | Date of their most recent booking |
| City | Customer's city |
Click on a row to go directly to that customer's detail page.
Using the Overview Effectively
- Check it daily — A quick glance at the stat cards tells you if today is on track.
- Compare periods — Switch between "Today", "Last 7 days", and "Last 30 days" to see trends at different scales.
- Watch the channels — If online bookings are declining, your website traffic may need attention. If POS bookings are increasing, your walk-in traffic is growing.
- Identify top performers — Your top products and experiences deserve the most attention in terms of inventory and availability.
Permissions
Access to different report tabs is controlled by permissions:
| Permission | What It Unlocks |
|---|---|
| Reports Overview | Access to the Overview tab (required to see the Reports page at all) |
| Reports Revenue | Revenue figures and financial data |
| Reports Rentals | The Rentals report tab |
| Reports Experiences | The Experiences report tab |
| Reports Customers | The Customers report tab |
| Reports Inventory | Inventory-related data on the Rentals tab |
| Reports Export | The ability to export report data |
By default, Admin users have access to all reports. Manager users have access to all except revenue. Staff users do not have report access by default.
If you cannot see a tab, ask your account Admin to check your permissions under Settings > Team & Permissions.