Customer Reports
The Customers tab in Reports helps you understand who your customers are, how your customer base is growing, and who your most valuable customers are. Use these insights to tailor your marketing and improve customer retention.
Opening Customer Reports
- Click Reports in the left sidebar.
- Click the Customers tab.
You need the Reports Customers permission to access this tab.
Stat Cards
The stat cards at the top provide a quick snapshot of your customer metrics for the selected time period.

| Card | What It Shows |
|---|---|
| Total customers | Total number of unique customers during the period |
| New customers | Number of first-time customers during the period |
| Returning customers | Number of customers who have booked before |
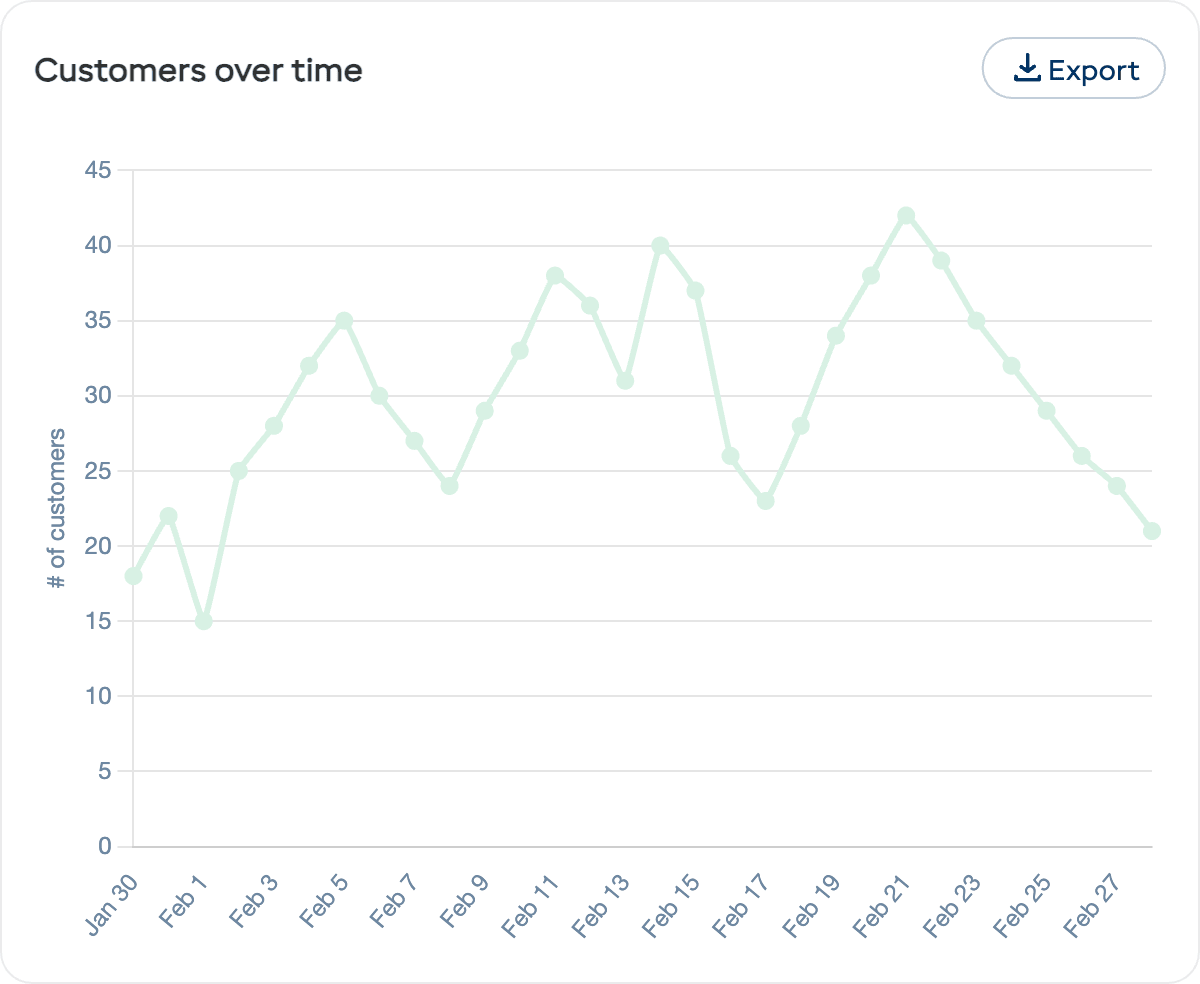
Customers Over Time
The Customers over time chart shows how your customer base has changed across the selected period. Each data point shows the number of customers for that day or week.
New vs Returning Customers
The New vs returning customers chart is a stacked bar chart breaking down your bookings into those made by New customers (first-time bookers) versus Returning customers (who have booked before).
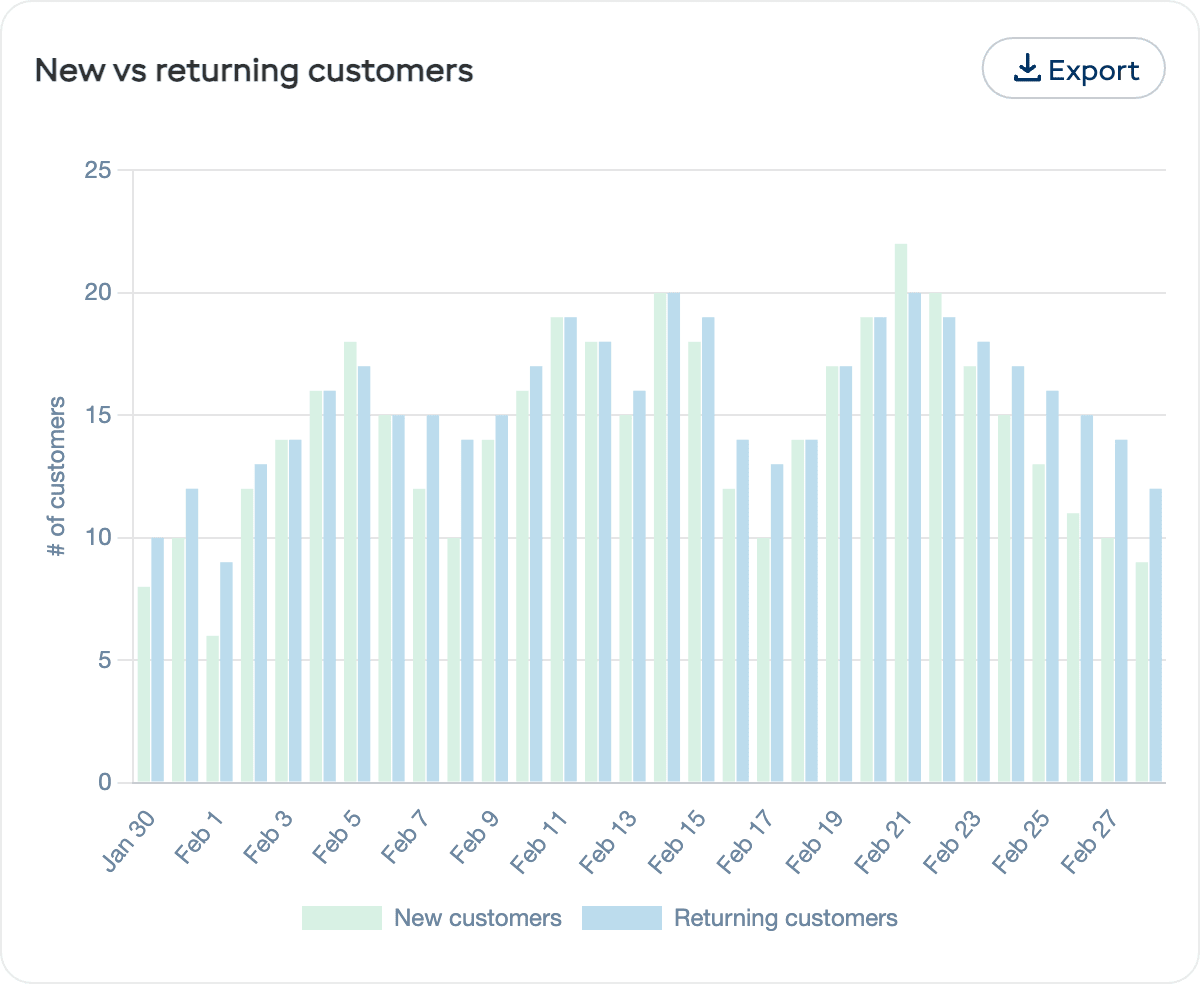
- High new customer % — Your marketing is bringing in fresh faces, but retention may need work
- High returning customer % — Great loyalty, but make sure you are also attracting new customers
- Balanced mix — The ideal scenario for sustainable growth
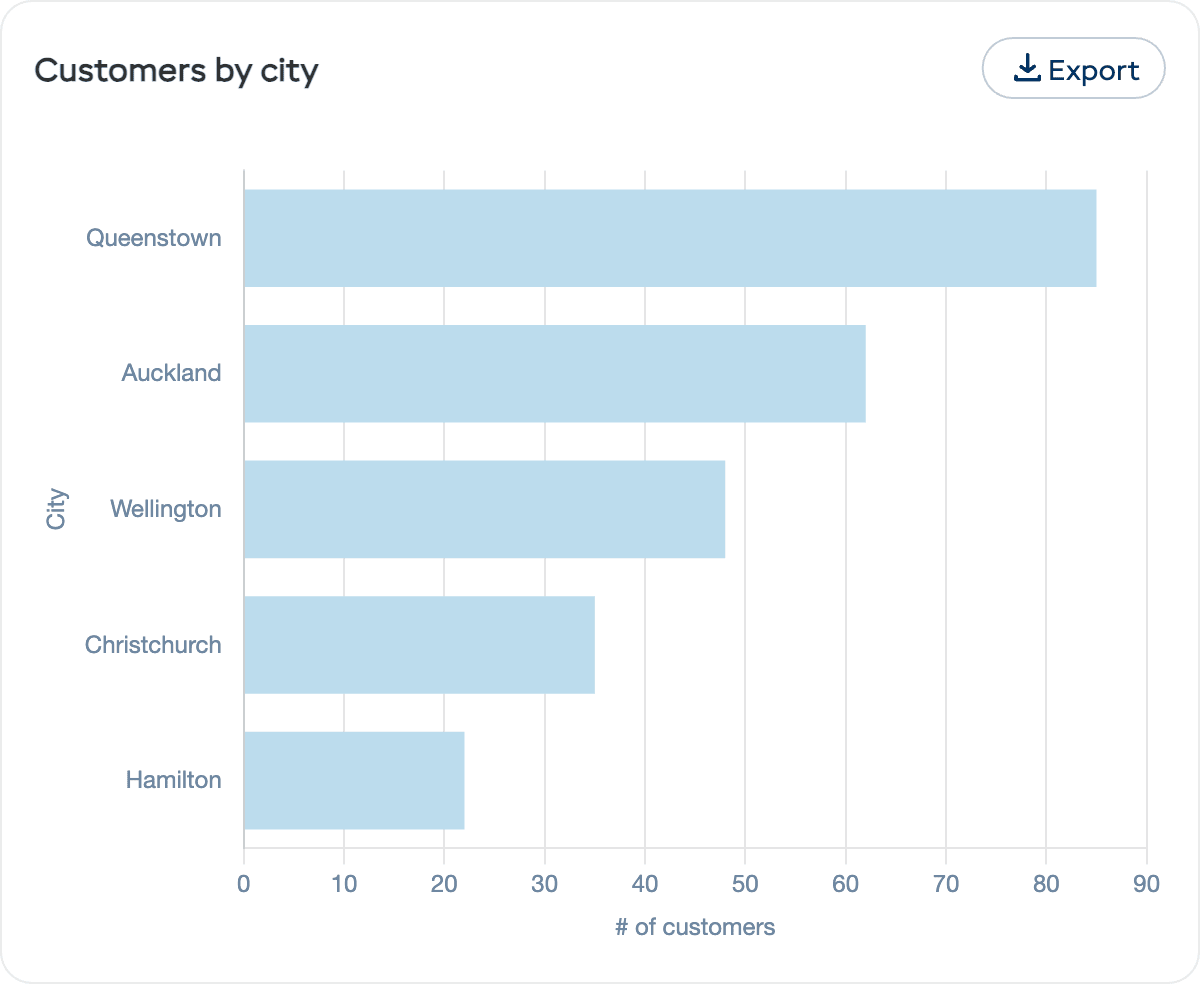
Customers by City
The Customers by city chart is a horizontal bar chart showing where your customers are located, based on the city from their profile or booking details. This helps you:
- Target local marketing to your most common customer areas
- Identify growth areas where you are gaining traction
- Understand your reach — are you primarily serving locals or tourists?
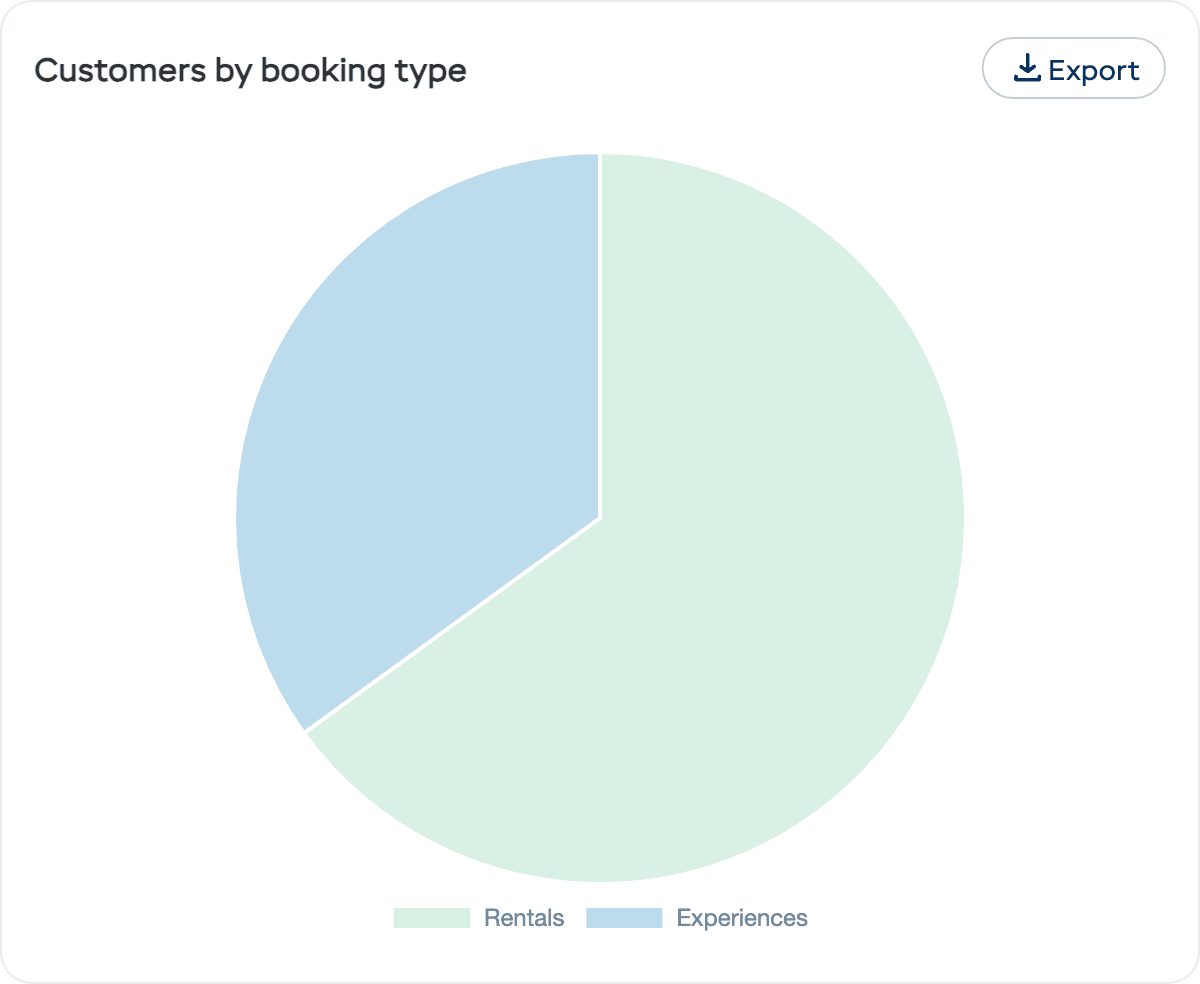
Customers by Booking Type
The Customers by booking type chart is a pie chart showing how your customers split between Rentals and Experiences bookings. This helps you understand which service type drives the most customer engagement.
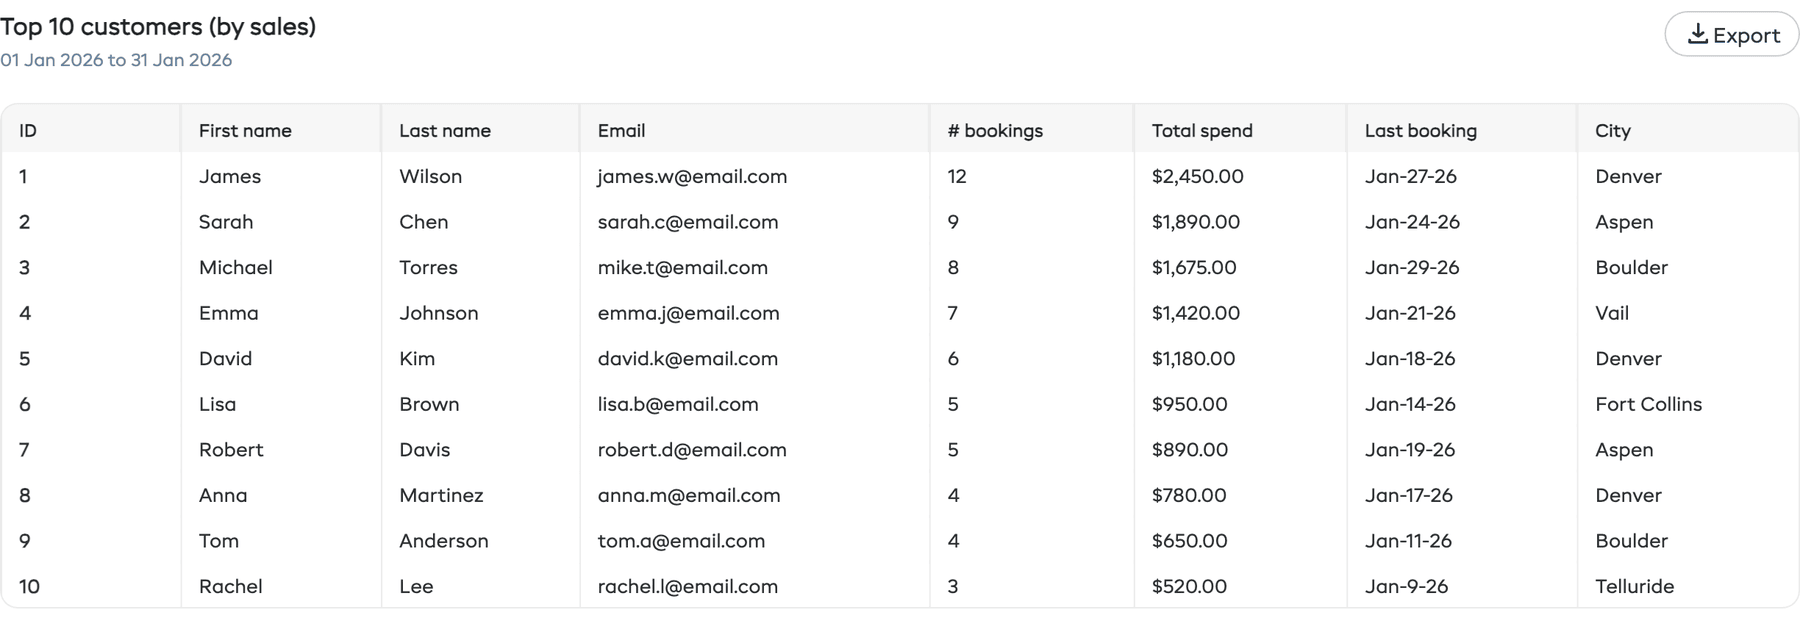
Top 10 Customers (by Sales)
At the bottom of the Customers tab is a Top 10 customers (by sales) table showing your highest-spending customers. The table includes:
| Column | Description |
|---|---|
| First name | Customer's first name |
| Last name | Customer's last name |
| Customer's email address | |
| # bookings | Total number of bookings |
| Total spend | Total revenue from this customer |
| Last booking | Date of their most recent booking |
| City | Customer's city |
Click on any row to go directly to that customer's detail page. Use the Export button to download the table data as CSV.
How to Use Customer Reports
| Goal | What to Look At |
|---|---|
| Grow your customer base | Track customers over time — is the trend going up? |
| Improve retention | Check new vs returning ratio — aim for at least 30–40% returning |
| Reward top customers | Use the top customers table to identify VIPs |
| Target marketing geographically | Customers by city shows where your audience lives |
| Understand your service mix | Customers by booking type reveals whether rentals or experiences drive engagement |