Rental Reports
The Rentals tab in Reports gives you a detailed look at how your rental products are performing. Use it to track revenue, spot patterns in booking times, identify your top categories, and understand how long customers are renting for.
Opening Rental Reports
- Click Reports in the left sidebar.
- Click the Rentals tab.
You need the Reports Rentals permission to access this tab.
Stat Cards
The stat cards at the top summarise your key rental metrics for the selected time period.

| Card | What It Shows |
|---|---|
| Sales | Total rental revenue for the period |
| Bookings received | Number of rental bookings created during the period |
| Avg. rental duration | Average length of rental bookings (e.g. "48 hours") |
| Utilization rate | Percentage of available inventory time that was rented out |
Bookings by Day of Week
The Bookings by day of week chart is a stacked bar chart showing which days get the most rental activity. It separates Pickup day and Dropoff day so you can see both demand patterns.
You can switch between By quantity (booking count) and By value (revenue) using the dropdown.
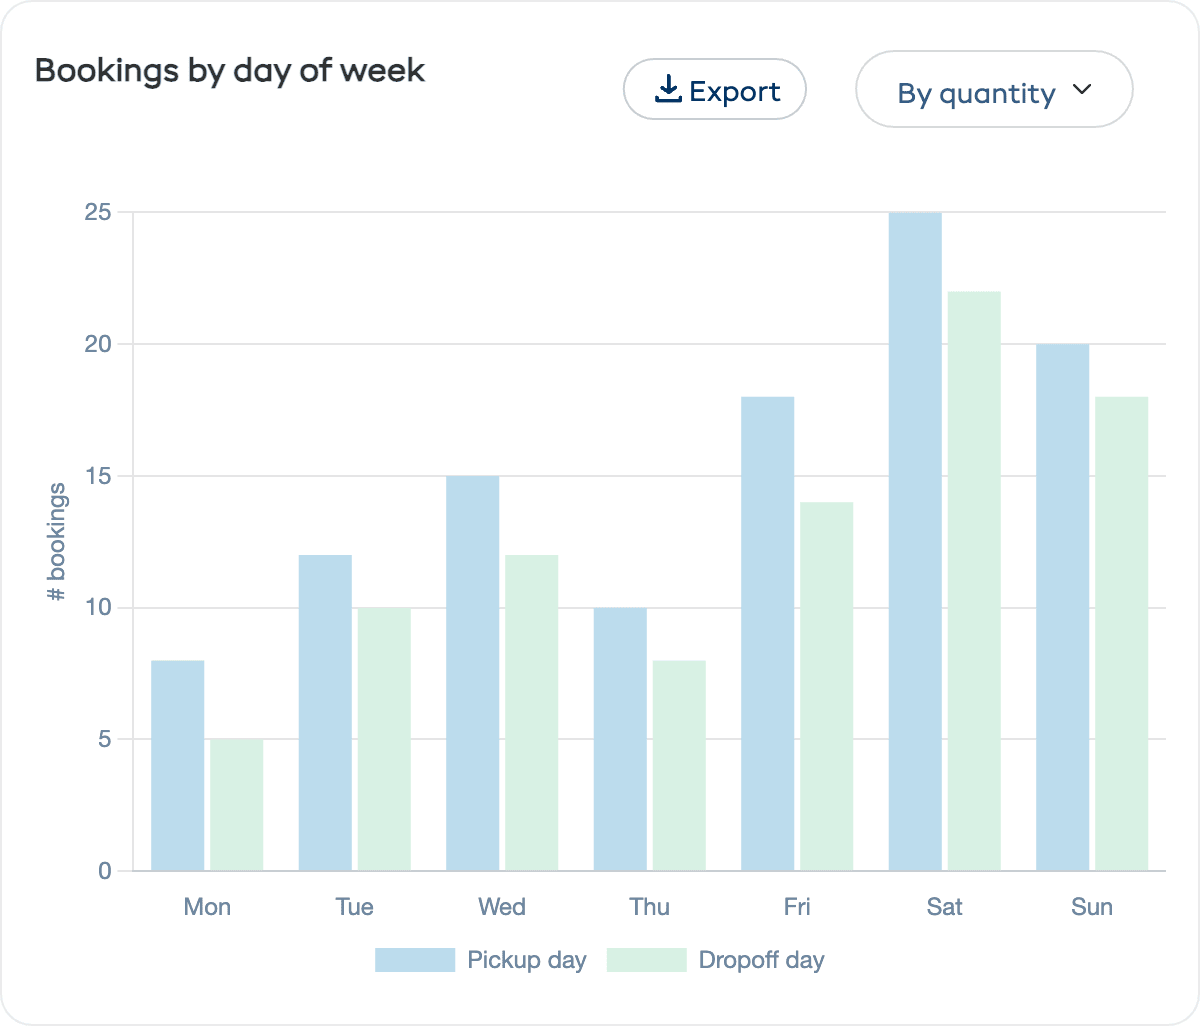
This is invaluable for:
- Staffing decisions — Schedule more staff on your busiest pickup and dropoff days
- Promotions — Run midweek promotions if weekdays are slow
- Inventory planning — Ensure full stock is available on peak days
Bookings by Time of Day
The Bookings by time of day chart shows what time customers are picking up and dropping off their rentals. It is a stacked bar chart with Pickup time and Dropoff time separated.
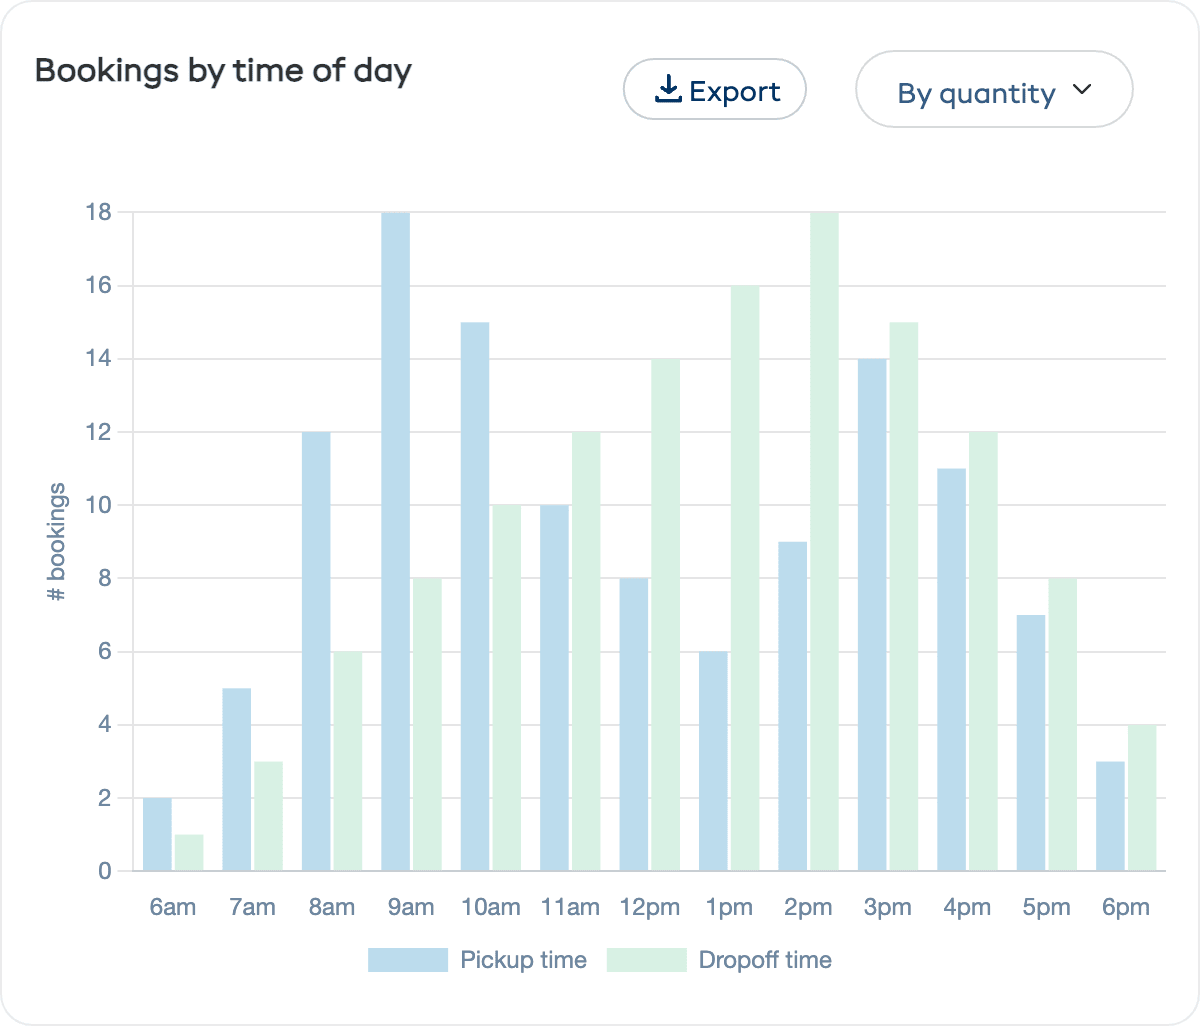
Use this to:
- Set your opening hours to match demand
- Plan staff shifts around peak pickup and dropoff times
- Offer early bird or late pickup deals during quiet windows
Top 5 Categories
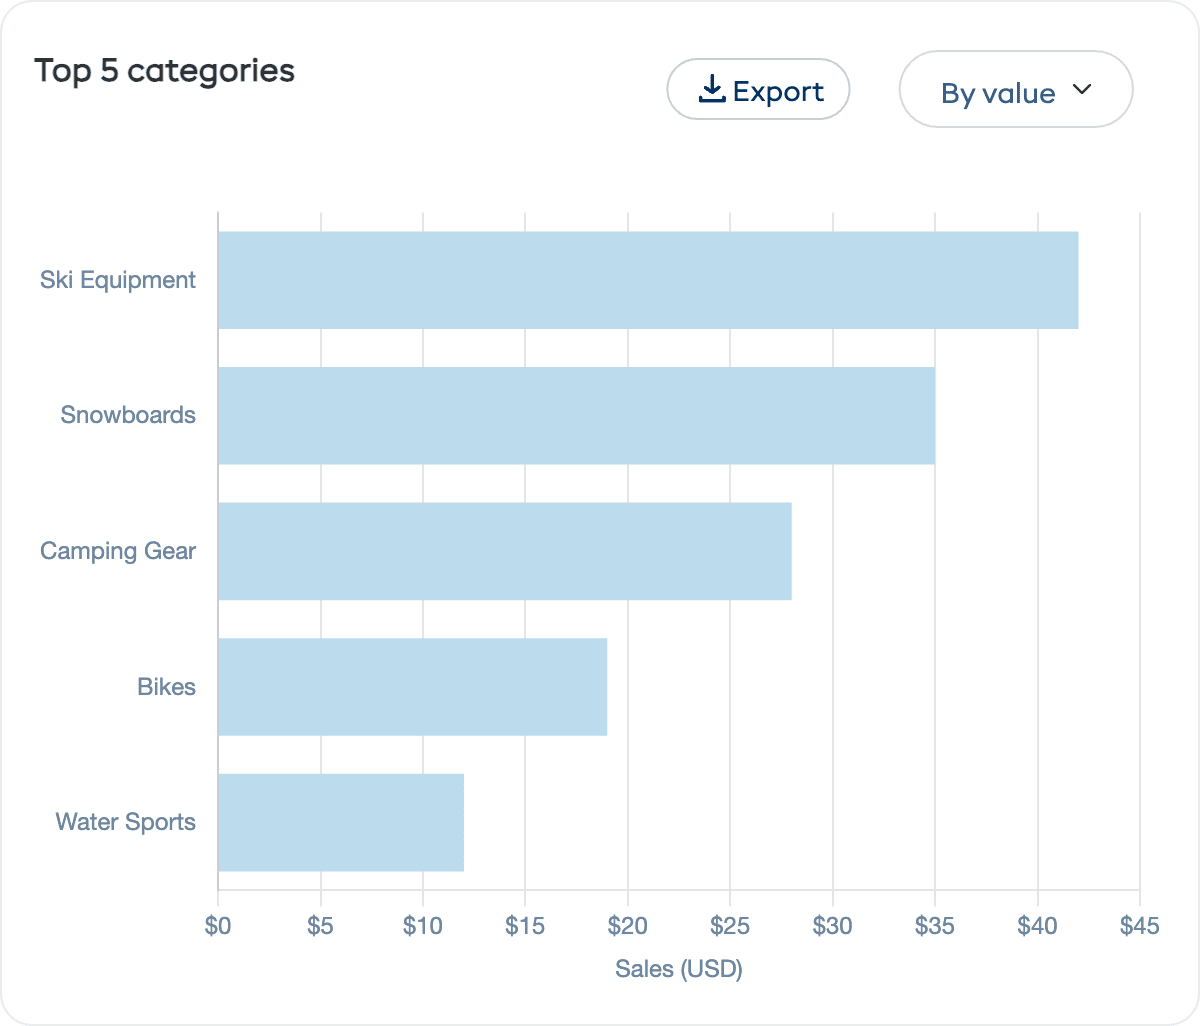
A horizontal bar chart ranking your product categories by booking volume or revenue. Use the By value / By quantity dropdown to switch views. This shows you which types of equipment are driving the most business.
Top 5 Rentals
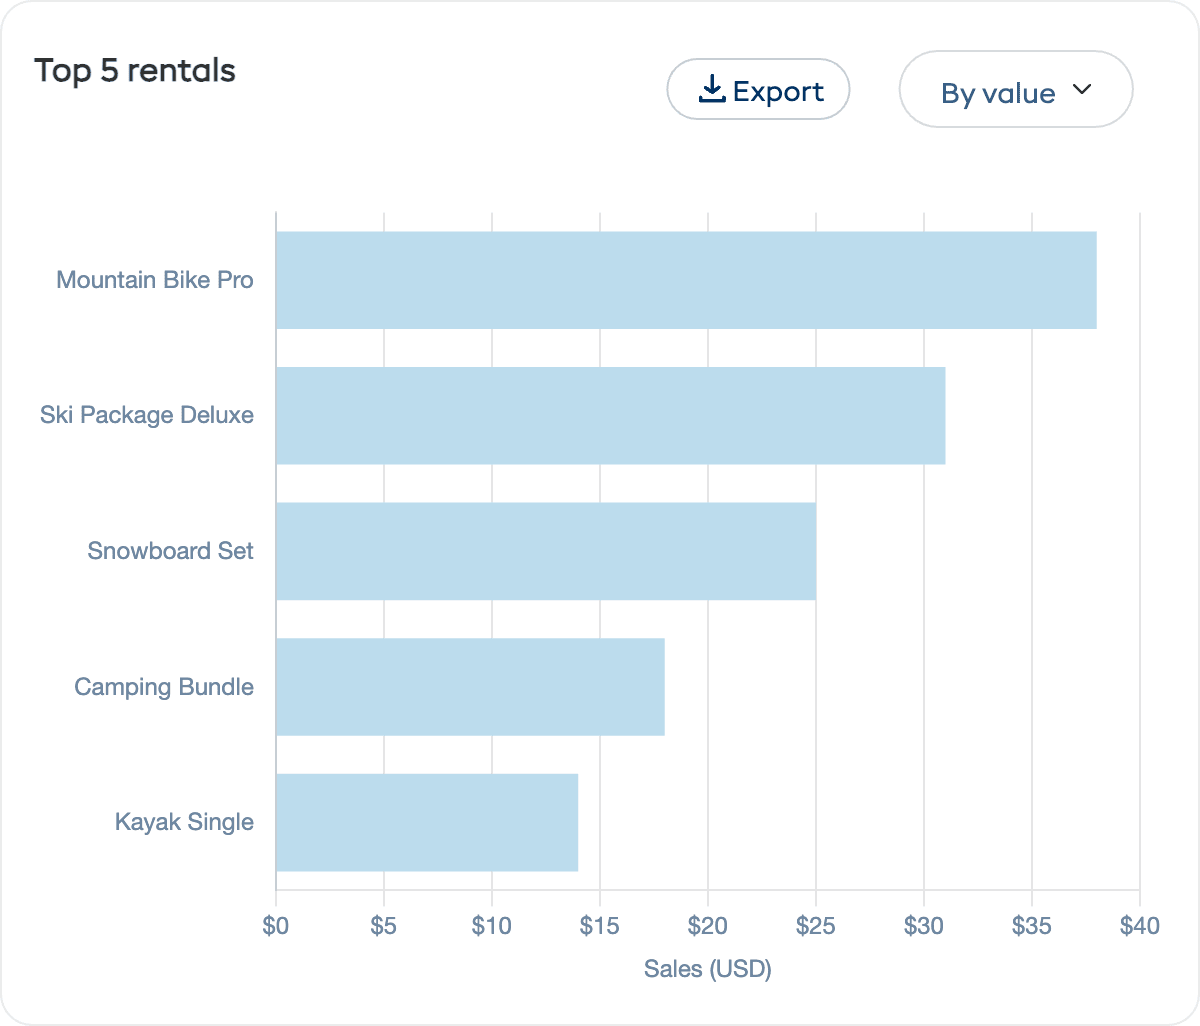
A horizontal bar chart of your most popular rental products by booking count or revenue. Use this to focus marketing on proven winners and investigate low-performing products.
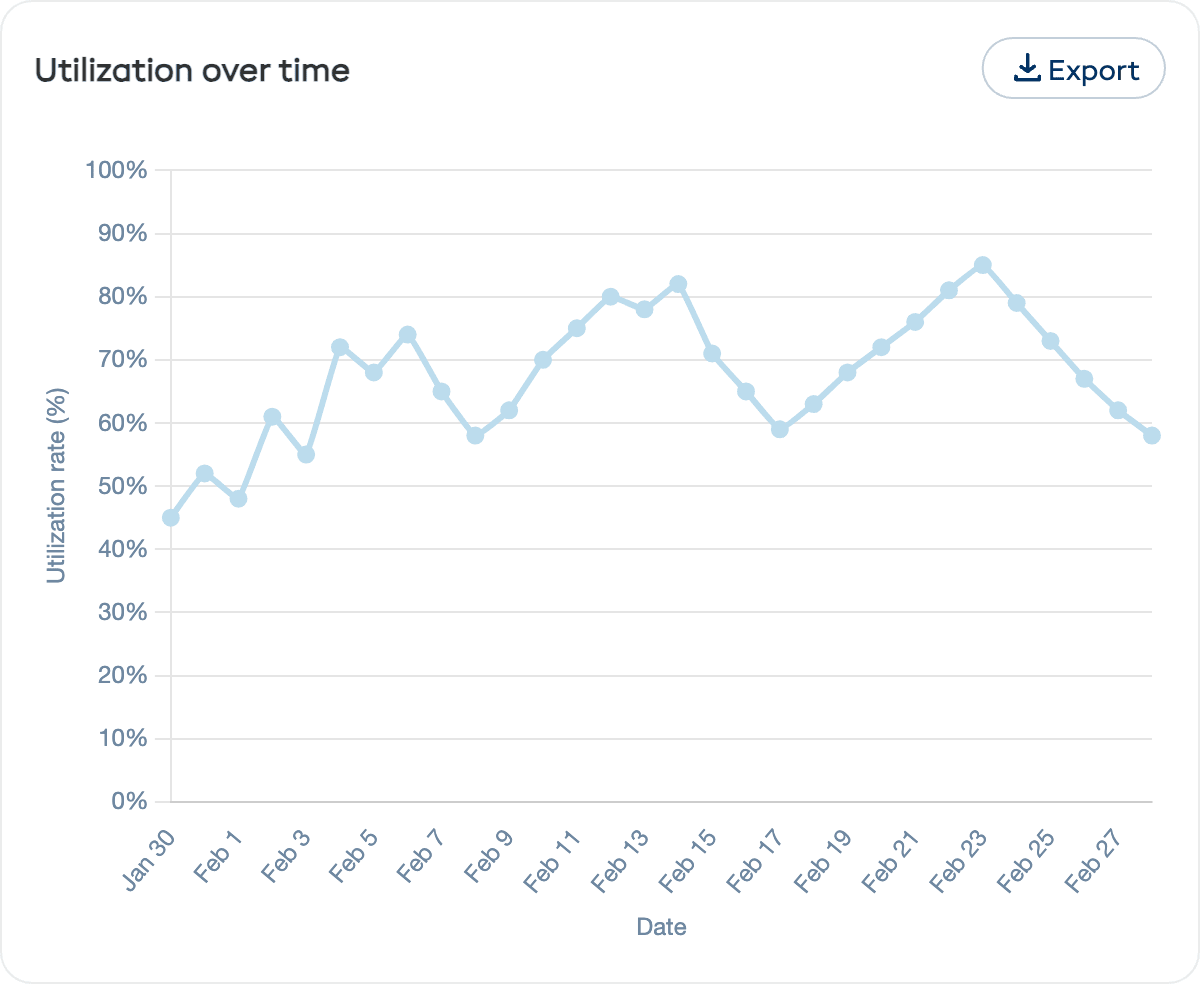
Utilisation Over Time
The Utilization over time chart is a line chart showing your utilisation rate trend across the selected period. The y-axis shows 0–100%. Use this to see if your inventory efficiency is improving or declining over time.
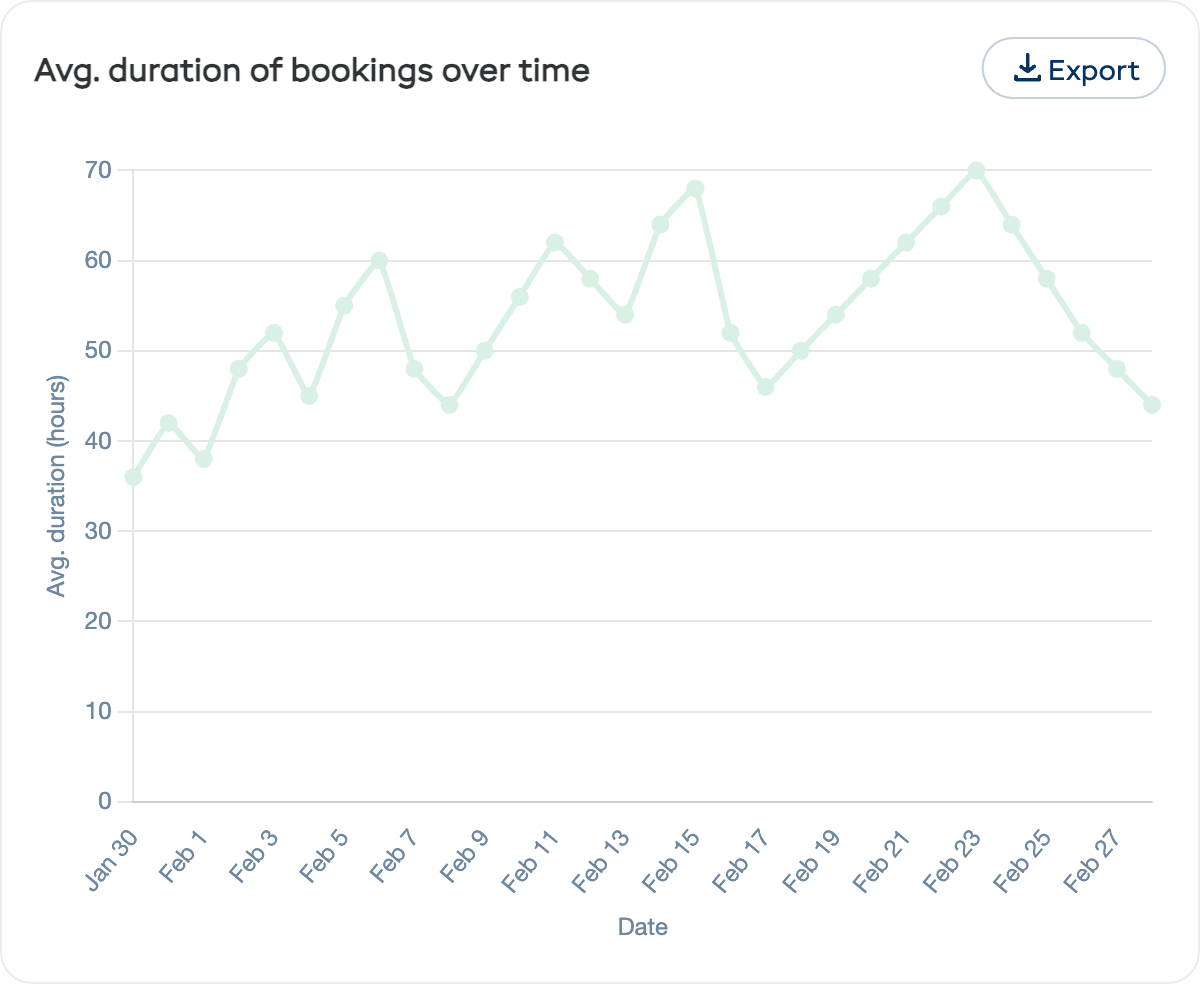
Avg. Duration of Bookings Over Time
A line chart showing how the average rental duration changes over the period. This helps you understand trends — are customers renting for longer or shorter periods?
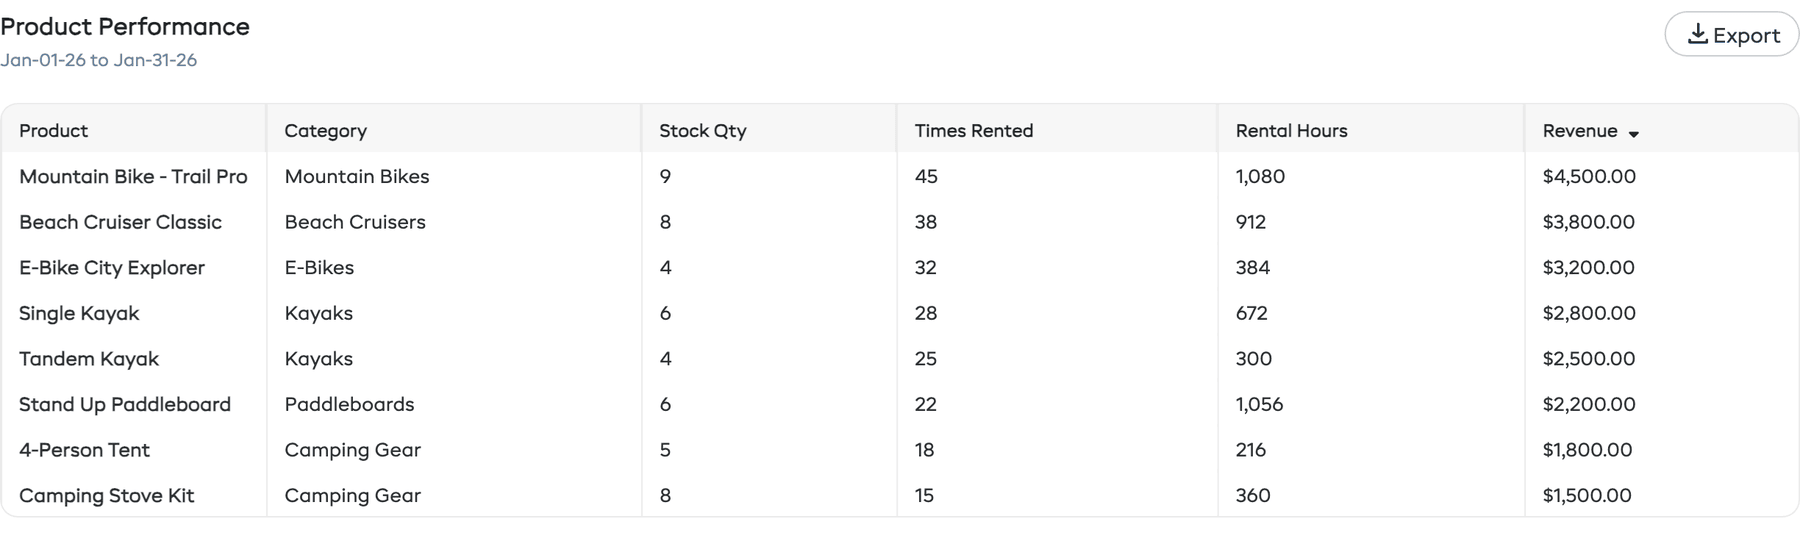
Product Performance Table
At the bottom of the Rentals tab is a Product Performance table that ranks your products by key metrics:
| Column | Description |
|---|---|
| Product | The product name |
| Category | Which category the product belongs to |
| Stock Qty | Number of inventory units |
| Times Rented | How many times this product was booked during the period |
| Rental Hours | Total hours this product was rented out |
| Revenue | Total revenue generated by this product |
Click on any row to go directly to that product's detail page. Use the Export button to download the table data as CSV.
How to Use Rental Reports
| Goal | What to Look At |
|---|---|
| Increase revenue | Check utilisation — if it is low, focus on marketing or pricing. If it is high, consider expanding inventory. |
| Optimise staffing | Look at bookings by day and time to match staff schedules to demand. |
| Improve pricing | Review average rental duration to make sure your pricing tiers align with how customers actually rent. |
| Spot trends | Compare "Last 7 days" to "Last 30 days" to see if recent performance is above or below your average. |
| Identify bestsellers | Top categories and top rentals show you where to invest in new or replacement equipment. |