Return on Investment Report
Every item you buy to rent out is money spent up front that comes back to you a little at a time. The Return on investment report answers the question you actually care about: has this item paid for itself yet?
It puts what you paid for an item next to what that item has earned, item by item, so you can see which purchases have already made their money back, which are still working on it, and which ones are not worth replacing.
Before You Start
The report is built from the purchase cost you record against your items. Until you enter a cost somewhere, the report has nothing to compare your income against.
You enter the cost when you add stock, or at any time afterwards by editing an item. In either panel, scroll to the bottom and click Advanced settings — Purchase cost and Purchase date are in there, kept out of the way of the fields you fill in every day. See Recording what an item cost.
You do not have to do them all at once. Start with your most expensive items — those are the ones where the answer matters most.
Who Can See It
You need permission to see revenue reports to open this report (the same permission as the Tax report), and permission to export reports to download the spreadsheet. Both are switched on for Admin users by default.
If you cannot see the tab, ask your account Admin to check your permissions under Settings > Team & Permissions. Team members who are not allowed to see revenue will not see this tab at all.
The report only appears if you have Rentals switched on. See Modules.
Finding the Report
- Click Reports in the left sidebar.
- Click the More tab, then choose Return on investment.
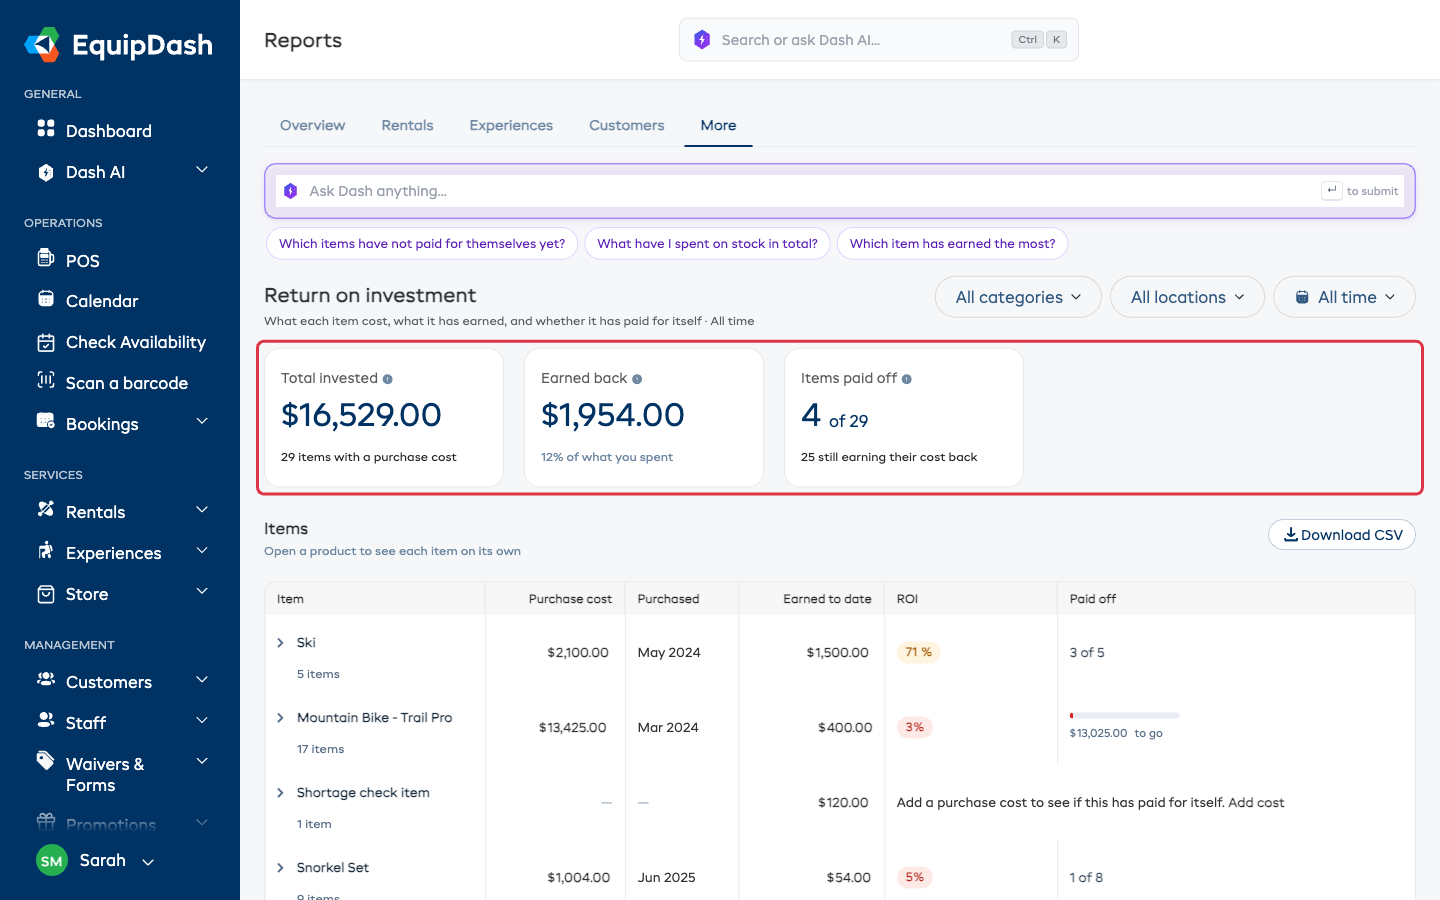
The Three Numbers at the Top
| Card | What it means |
|---|---|
| Total invested | What you paid for the items that have a purchase cost recorded. Underneath, the number of items that figure covers |
| Earned back | Rental income from those same items, plus what that comes to as a percentage of what you spent |
| Items paid off | How many of those items have earned back at least what they cost — and how many are still working on it |
Earned back only counts income from items that have a cost recorded, so the comparison is like for like. An item with no cost recorded can never make the percentage look better than it is.
Reading the Table
There is one row per product. The columns are:
| Column | What it shows |
|---|---|
| Item | The product name, and how many items you have of it |
| Purchase cost | What you paid in total for those items |
| Purchased | The month you bought them, or a range if you bought them at different times |
| Earned to date | Rental income those items have brought in |
| ROI | What you have earned back as a percentage of what you paid |
| Paid off | How far through paying for itself the product is |
The ROI color tells you the story at a glance
| Color | Meaning |
|---|---|
| Green | 100% or more — it has earned back everything it cost you, and is now pure return |
| Amber | 50–99% — over halfway there |
| Red | Under 50% — still early, or it is not being booked enough |
What the "Paid off" column says
- A green tick and Paid off with the date it happened — a single item that has covered its cost.
- A green tick and All 5 — every item of that product has covered its cost.
- 3 of 5 — three of the five have, the rest have not yet.
- A progress bar with $430.00 to go — how much more it needs to earn to break even.
Seeing Every Item on Its Own
A row like "17 items" adds all of them together, and a total hides the one that never gets picked. Click the product name (or the arrow beside it) to open the product and see each item underneath, with its own cost, purchase date, earnings and progress.
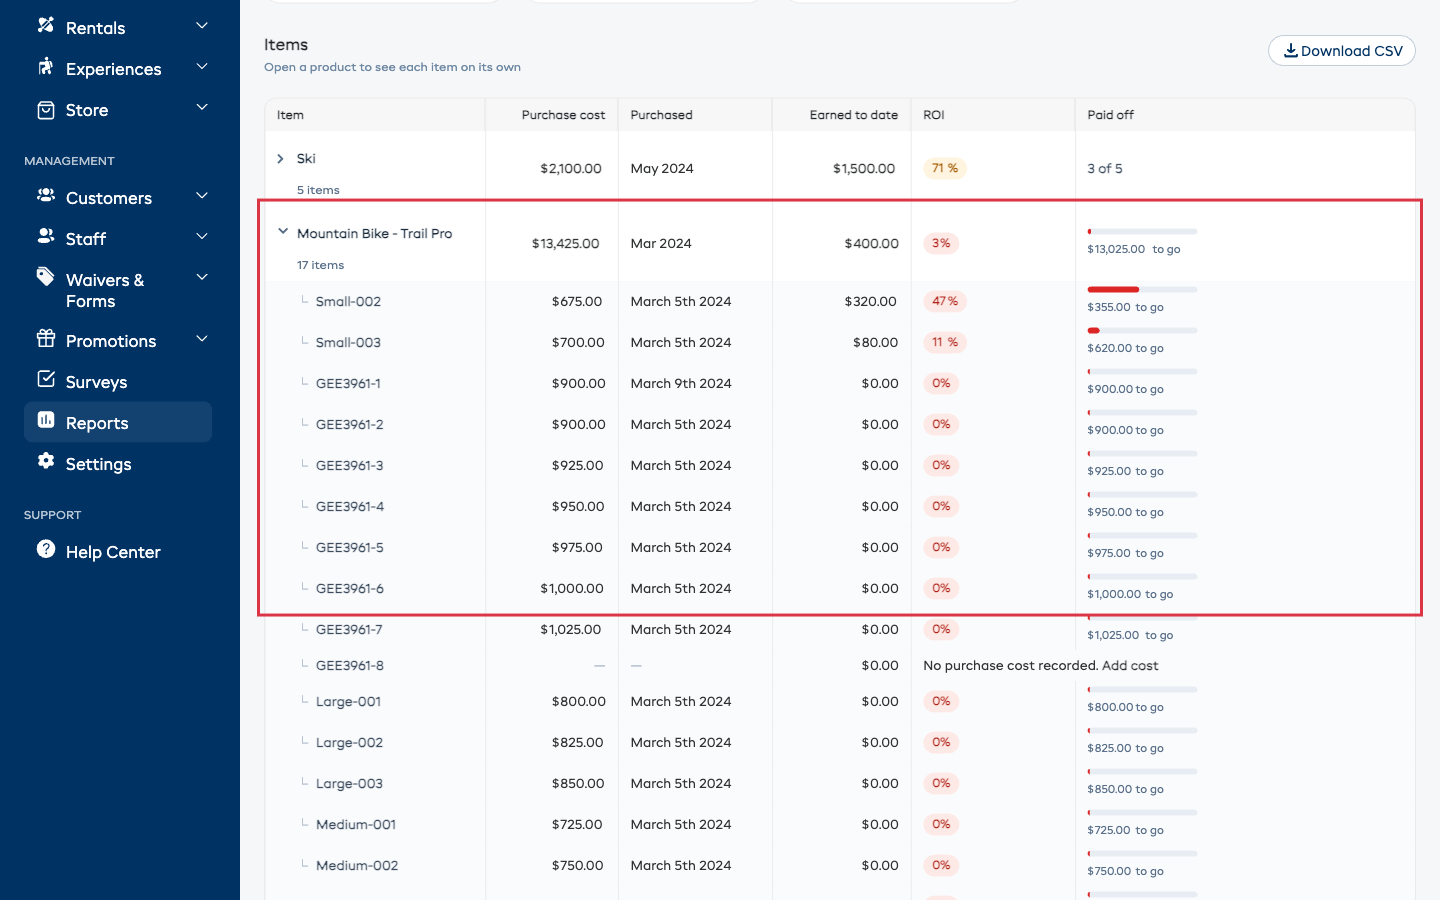
Items are listed highest-earning first, so the ones pulling their weight are at the top and the quiet ones sink to the bottom. This is where you find the item that has sat at the back of the shelf for two years while the others earned their keep.
Items With No Purchase Cost Recorded
If you have not recorded what something cost, its cost, purchase date and ROI show a dash — never a zero — and the row offers a shortcut:
Add a purchase cost to see if this has paid for itself. Add cost
Click Add cost to jump straight to that product. On its Inventory tab, edit the item, open Advanced settings at the bottom of the panel, and fill in what you paid.
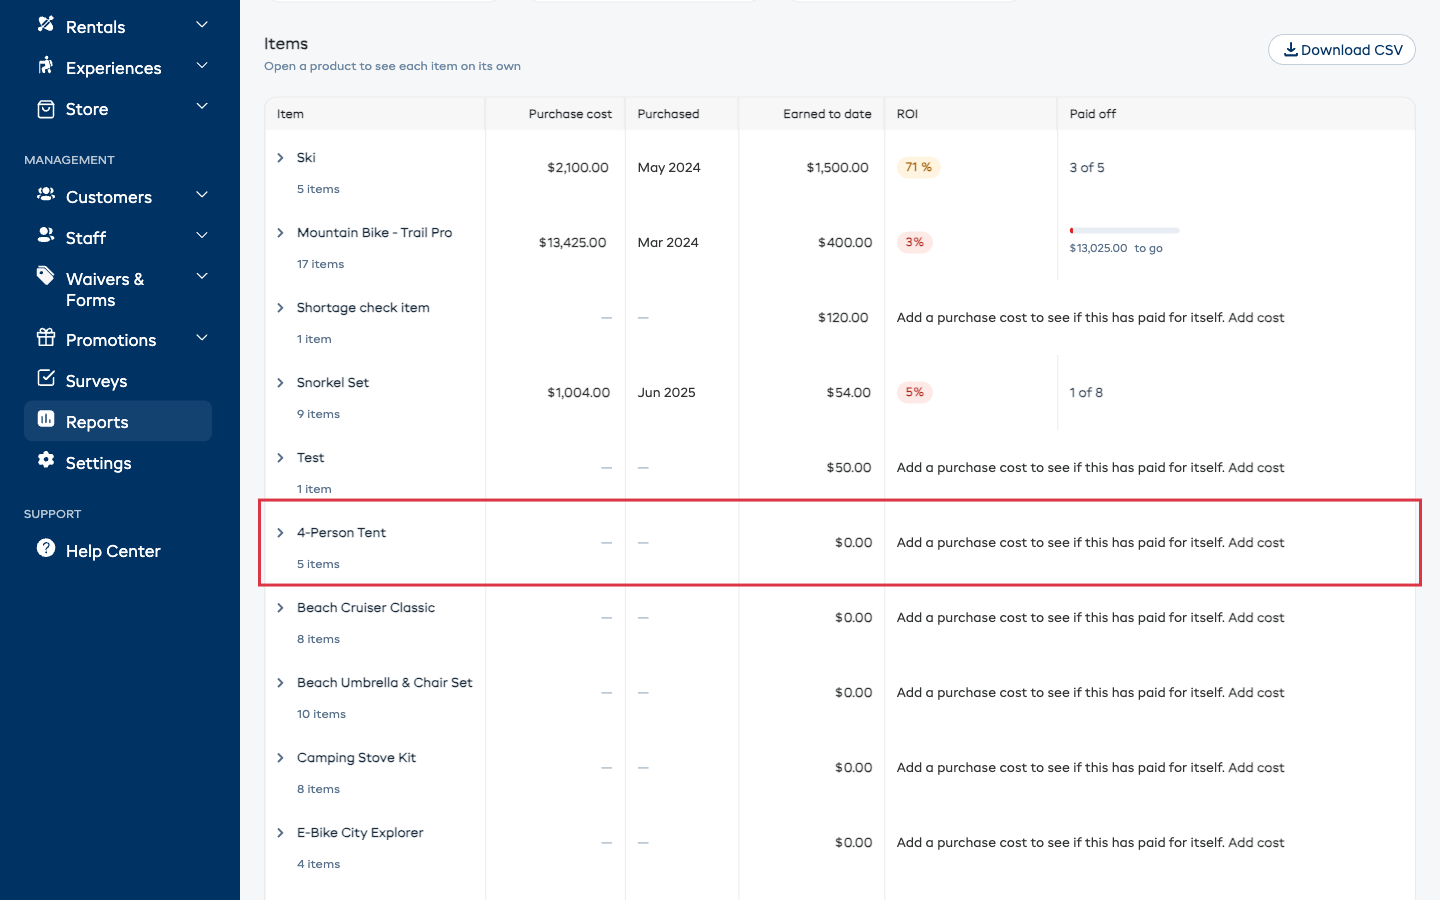
Open a product and you get the same shortcut on any single item that is missing a cost while the rest of them have one — it reads No purchase cost recorded with an Add cost link beside it.
Leaving the cost blank means "not recorded", not "it cost nothing". EquipDash never counts a blank as free and never claims a blank item has paid for itself.
Narrowing It Down
Three dropdowns sit at the top right of the report:
| Filter | What it does |
|---|---|
| Category | Show one category of products at a time |
| Location | Show only the items kept at one of your locations. It only appears if you have more than one location |
| Period | Which bookings to count the income from, based on when each booking was taken |
The period starts on All time, which is almost always what you want here — an item earns its cost back over years, not over the last seven days. The other choices are This year, Last year, This quarter, Last quarter, This month, Last month, Last 30 days, and Custom range for any two dates you pick.
Changing the period changes the Earned to date figures — it never changes what you paid.
Downloading the Spreadsheet
- Choose your category, location and period.
- Click Download CSV.
- Open the file in Excel or Google Sheets.
The download has a row for every product and a row for each individual item underneath it, with the purchase cost, purchase date, earnings, ROI, how many have paid off, and how much is still to earn back.
Items with no purchase cost recorded come through with an empty cost cell rather than a zero, so your own totals in the spreadsheet stay honest.
Good to Know
- Cancelled bookings and quotes are not counted as income.
- When several items go out on one booking, that booking's income for the product is shared evenly between them, so no single item gets credit for the whole thing.
- All amounts are in your own currency — a purchase cost is what you paid, so it is always shown in the currency your business works in.
- Only rental items appear here. Experiences and store products are not part of this report.
- An item that cost you nothing (a cost of 0 that you recorded on purpose) counts as already paid off.
Using It Well
- Before you buy another one, check whether the ones you already have are earning. Two items sitting idle is a sign to fix your listing, not to buy a third.
- Before you replace something, check whether it ever paid for itself. If it did not, the replacement probably will not either.
- When something reaches 100%, everything it earns from then on is profit — those are the products worth keeping in good condition and worth featuring.
- Sort out your worst performers by moving them to a busier location, bundling them with something popular, or selling them on.