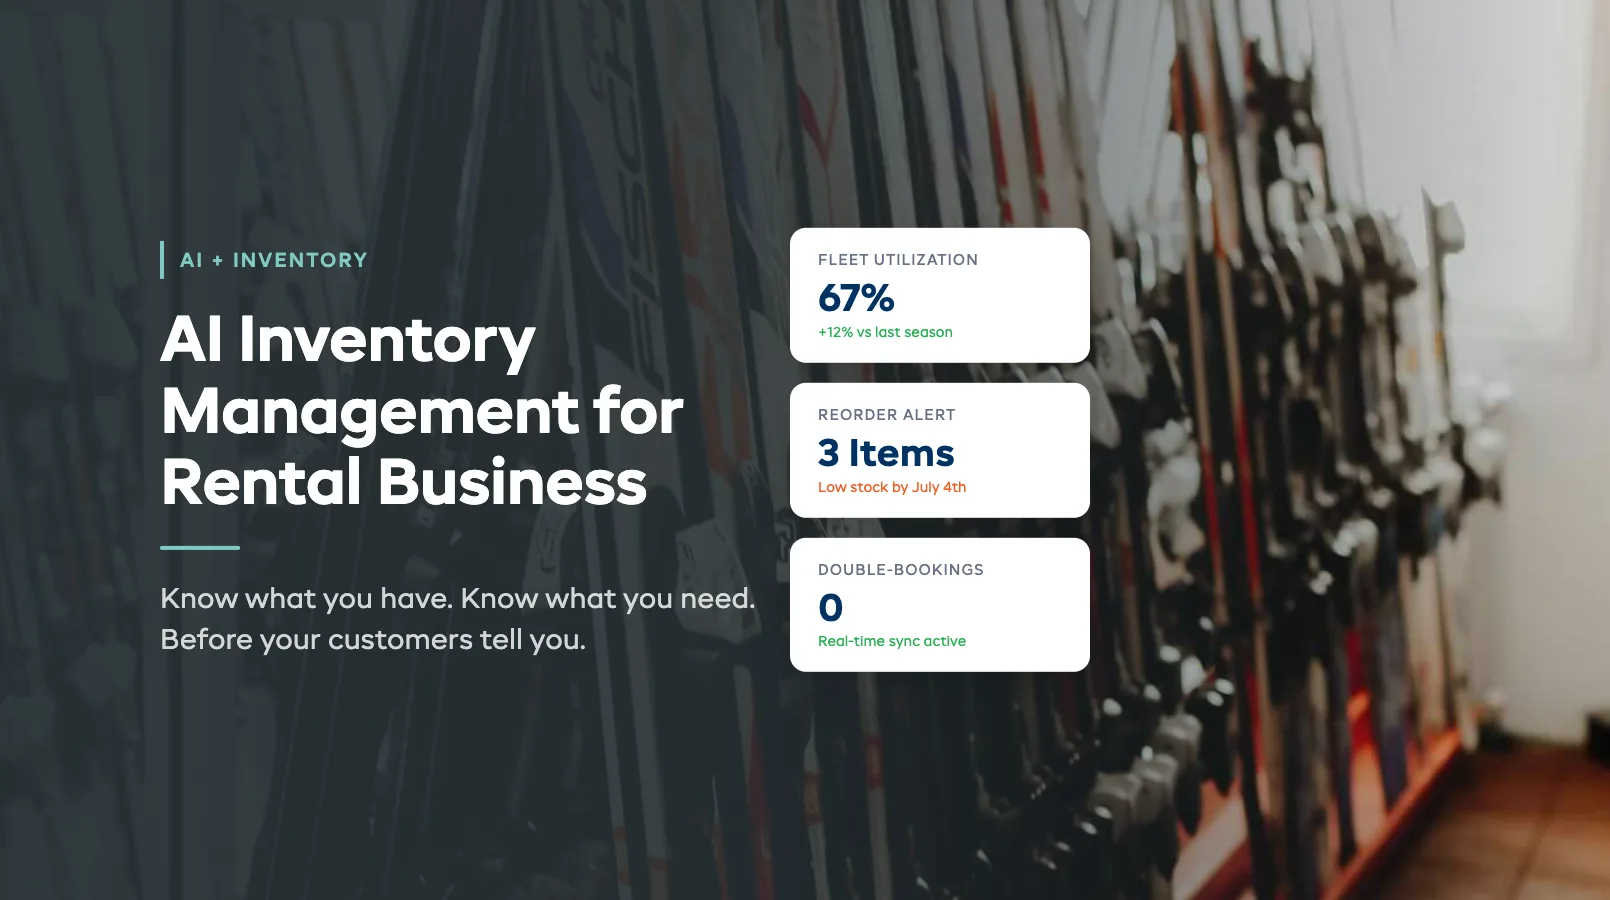
AI Inventory Management for Rental Business: Know What You Have, What You Need
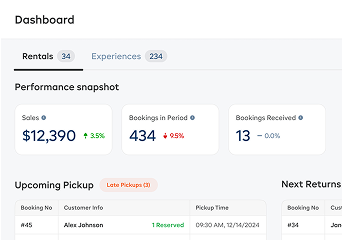
You open the shop on a Saturday morning. A family of four walks in wanting two tandem kayaks. You're pretty sure you have three available -- until you check the booking sheet and realize two went out yesterday for a multi-day rental. The third has a cracked hull sitting in the back room.
You apologize. They drive to the competitor down the road. That's $240 in revenue gone because your inventory system was a spreadsheet you updated when you remembered to.
AI inventory management doesn't just count what's on the rack. It tracks what's booked, what's coming back, what's overdue for service, and what you'll need three weeks from now based on the bookings already in your calendar. It turns reactive stock-checking into proactive fleet intelligence.
This guide covers the specific ways AI transforms rental inventory -- from automated reorder alerts to seasonal stock optimization. For the full picture of how AI applies across your operation, see our AI for Equipment Rental Business guide.
In this guide:
- Manual Inventory Tracking Is Costing You
- How AI Transforms Rental Inventory
- Auto-Reorder Alerts Based on Booking Trends
- Fleet Utilization Analysis
- Seasonal Stock Optimization
- Integration with Your Existing Workflow
- FAQ
Manual Inventory Tracking Is Costing You
Most rental shops track inventory one of two ways: a spreadsheet or their memory. Both fail under pressure.
The spreadsheet problem isn't accuracy on day one. It's accuracy on day 47. After six weeks of busy-season rentals, returns, damages, and maintenance pulls, your spreadsheet is a fiction. Staff forget to update it. Multi-day rentals don't get logged until return. Equipment in the repair queue still shows as "available."
The real costs of manual tracking:
- Double-bookings. Two customers show up for the same paddleboard because one booking was on the calendar and the other was a walk-in someone forgot to log. Average cost: $80-120 in lost revenue plus a bad review.
- Ghost inventory. Items show as available but aren't. They're in maintenance, on a multi-day rental, or sitting in the wrong location. You don't find out until a customer is standing at the counter.
- Overstocking. Without utilization data, you buy based on gut feel. That means 12 fishing kayaks when you needed 8, and zero extra paddleboards when you needed 6 more. Dead capital sitting on a rack versus lost revenue from turning people away.
- Missed reorders. You run out of helmets on a Friday afternoon. The supplier needs five business days to ship. That's a full week of turning away bike rental customers or sending them out without proper safety gear.
One mid-size kayak rental shop we spoke with estimated manual tracking errors cost them $18,000 per season in lost bookings, emergency rush orders, and customer refunds. That's not unusual.
![]()
How AI Transforms Rental Inventory
AI inventory management adds three capabilities that spreadsheets can't match: real-time awareness, pattern recognition, and forward-looking predictions.
Real-time awareness means your inventory count reflects reality at any given moment. When a customer books a mountain bike for Saturday, that bike is immediately blocked from availability. When it comes back and passes the condition check, it's available again. When it gets pulled for maintenance, it drops off the available count. No manual updates. No lag.
Pattern recognition means the system learns from your data. It notices that tandem kayaks book 3x more on weekends than weekdays. That paddleboard demand spikes 40% when the temperature crosses 28C. That your "premium" tier bikes have 15% higher utilization than standard -- which means you should probably shift your fleet mix.
Forward-looking predictions are where the real value hits. Based on current bookings, historical patterns, and external signals (weather, local events, school holiday calendars), AI projects your inventory needs 2-4 weeks ahead. Not perfectly. But accurately enough to act on.
Here's what this looks like in practice:
| Capability | Spreadsheet | AI-Powered |
|---|---|---|
| Current stock count | Updated manually, often stale | Real-time, auto-synced with bookings |
| Availability forecast | None -- you check day-of | 2-4 week rolling projection |
| Reorder timing | When you notice something's low | Alert based on burn rate + lead time |
| Utilization tracking | Not tracked | Per-item percentage, rolling 90-day window |
| Seasonal planning | Gut feel from last year | Data-driven projections by category |
The shift isn't about replacing your judgment. It's about giving you data you've never had access to -- so your judgment is based on numbers instead of guesses.
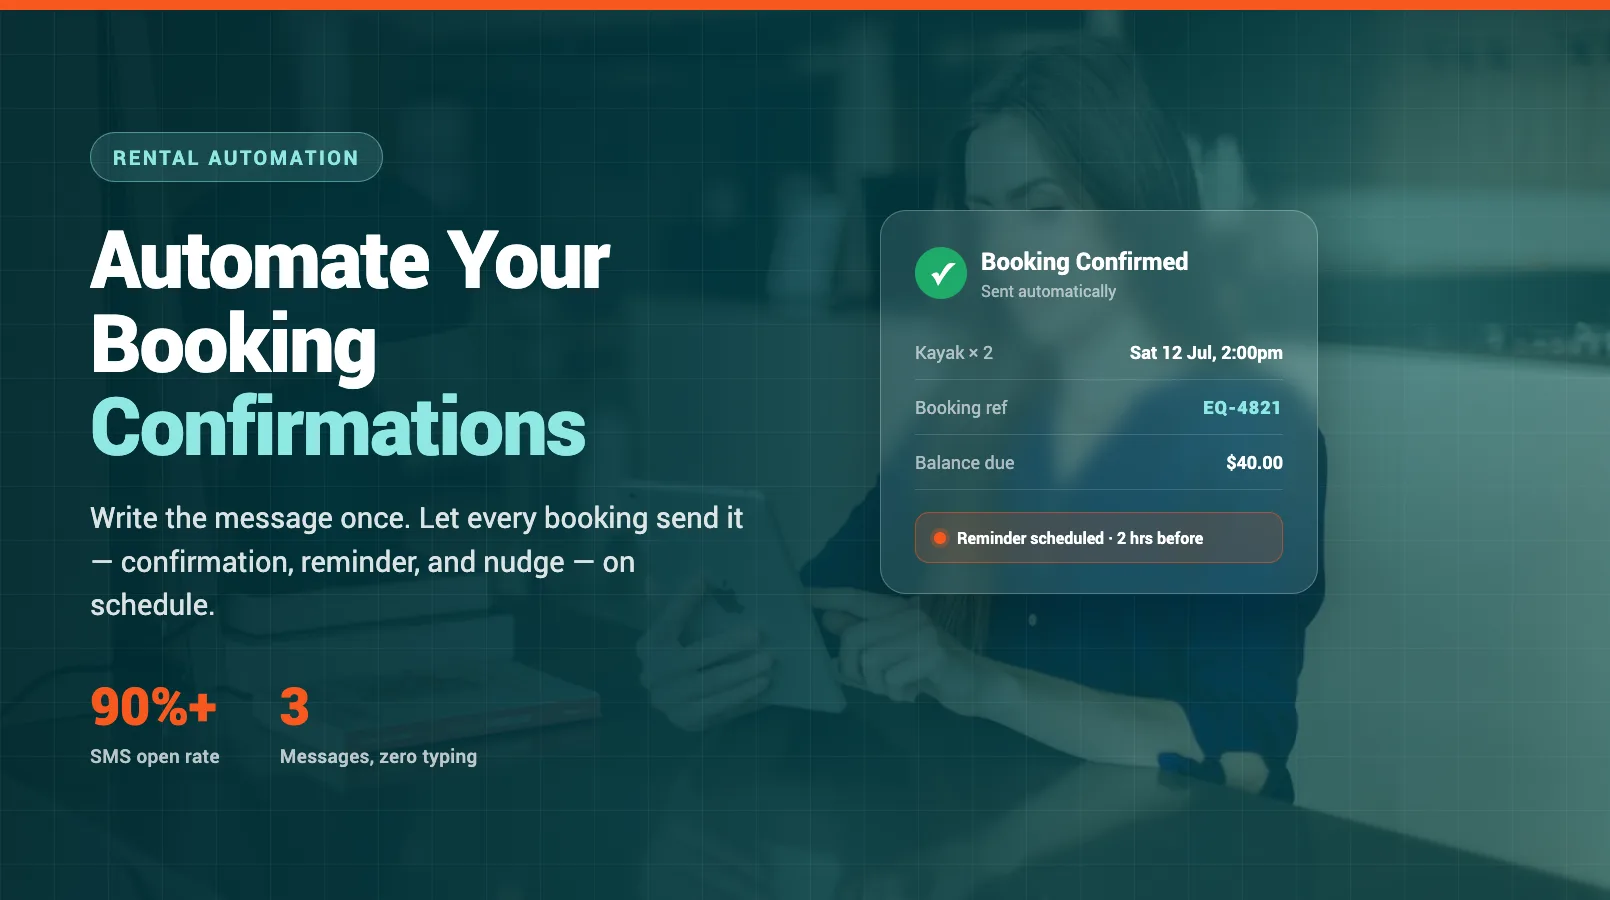
Auto-Reorder Alerts Based on Booking Trends
Running out of consumables mid-season is preventable. The challenge is that burn rates change constantly.
You go through 30 dry bags per week in July and 8 per week in May. If your reorder threshold is "below 20 in stock," you'll be fine in May and empty by Wednesday in July. Static thresholds don't work for seasonal businesses.
AI-powered reorder alerts account for:
- Current burn rate. Not how many you used last month. How many you're using this week, extrapolated forward.
- Supplier lead time. If your helmet supplier needs 7 business days to deliver, the alert fires when your projected stock level will hit zero in 9 days -- giving you a two-day buffer.
- Upcoming demand signals. A holiday weekend is coming? Local surf competition booked? The system factors in the demand spike before it happens.
- Multi-location balancing. If you run two locations, AI flags when Location A has 4 spare life jackets and Location B is running low -- before you place a new order.
The consumables that benefit most:
- Safety gear (helmets, PFDs, first-aid supplies)
- Wear items (brake pads, paddle grips, wetsuit zippers)
- Rental accessories (dry bags, phone pouches, sunscreen)
- Cleaning supplies (especially in high-turnover summer months)
For hard assets -- the kayaks, bikes, and boards themselves -- reorder alerts work differently. The system flags when your fleet can't cover projected demand. "Based on current booking trends, you'll be short 3 single kayaks by the July 4th weekend. Current utilization on singles: 89%."
That's a signal to either acquire more units, adjust pricing to manage demand, or both. For a detailed look at how AI pricing adjustments complement inventory decisions, see our AI Dynamic Pricing guide.
Fleet Utilization Analysis
Every piece of rental equipment is a small investment. A $1,200 paddleboard that sits on the rack 70% of the time is a bad investment. A $1,200 paddleboard that's booked 65% of available hours is a good one.
Most operators don't know their per-item utilization rate. They know which gear "seems popular" and which "doesn't go out much." AI turns that gut feeling into hard numbers.
What utilization analysis tracks:
- Per-item rental hours. Paddleboard #7 logged 312 rental hours this season. Paddleboard #8 logged 89 hours. Same model, same condition, different rack position. (It turns out #8 was stored in the back and staff defaulted to grabbing the front-row boards.)
- Category-level trends. Single kayaks average 62% utilization. Tandems average 34%. Fishing kayaks average 28%. That tells you where to invest next season -- and what to discount or retire.
- Revenue per unit. Utilization alone isn't enough. A premium e-bike at 45% utilization might generate more revenue than a standard bike at 70% utilization because of the rate difference. AI tracks both metrics together.
- Day-of-week patterns. Mountain bikes peak on Saturdays (88% utilization) and crater on Tuesdays (22%). That's useful for targeted midweek promotions.
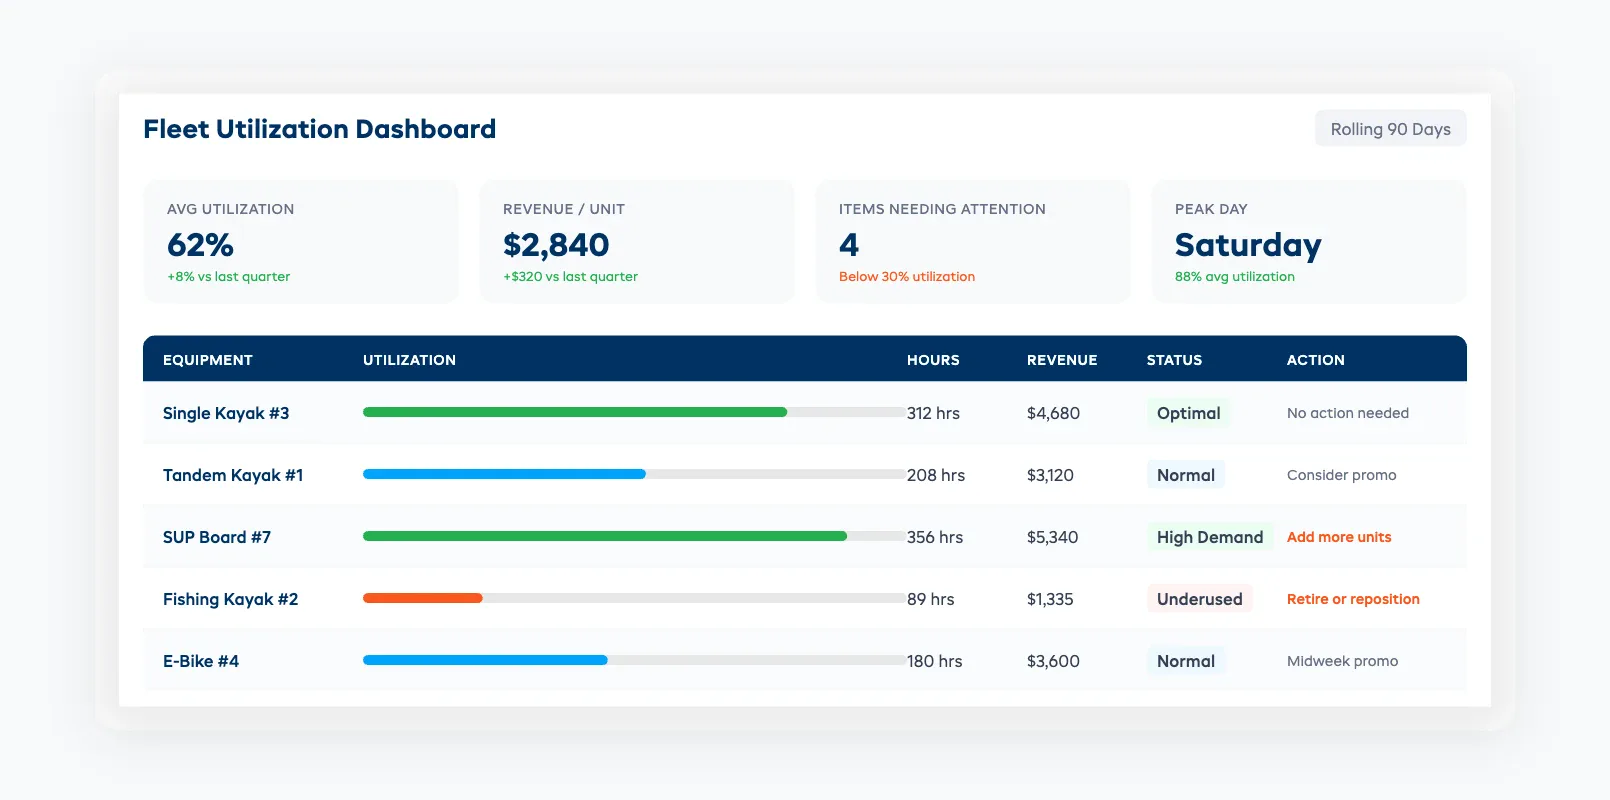
Actionable decisions from utilization data:
- Items below 30% utilization for 90+ days: consider retiring, discounting, or repositioning (move to a busier location)
- Items above 85% utilization: you need more of these. Every hour they're booked is an hour you might be turning customers away
- Items with high utilization but frequent maintenance flags: these are being overworked. Add units to spread the load. Our Predictive Maintenance guide covers how to set up usage-based service triggers
The goal isn't 100% utilization -- you need buffer for walk-ins and scheduling flexibility. Most operators target 55-70% utilization across their fleet as the sweet spot between revenue maximization and customer availability.
Seasonal Stock Optimization
Seasonal rental businesses face a math problem: you need maximum inventory for 3-4 months and minimal inventory for the rest of the year. Every extra unit you carry through the off-season is dead capital. Every unit you don't have during peak is lost revenue.
AI seasonal optimization uses your historical data to model this curve:
Pre-season (6-8 weeks before peak):
- Project peak demand by equipment category based on last year's actuals plus current early-booking trends
- Flag categories where early bookings are running ahead of last year ("SUP bookings are 23% above same-period last year -- consider adding 4 units")
- Identify slow movers from last season that probably shouldn't be restocked
Peak season (active management):
- Daily utilization monitoring with weekly trend reports
- Dynamic reorder recommendations as demand patterns become clearer
- Cross-category substitution suggestions ("Paddleboard availability is at 95% this weekend. Consider offering kayak upgrades to overflow customers at a 10% discount")
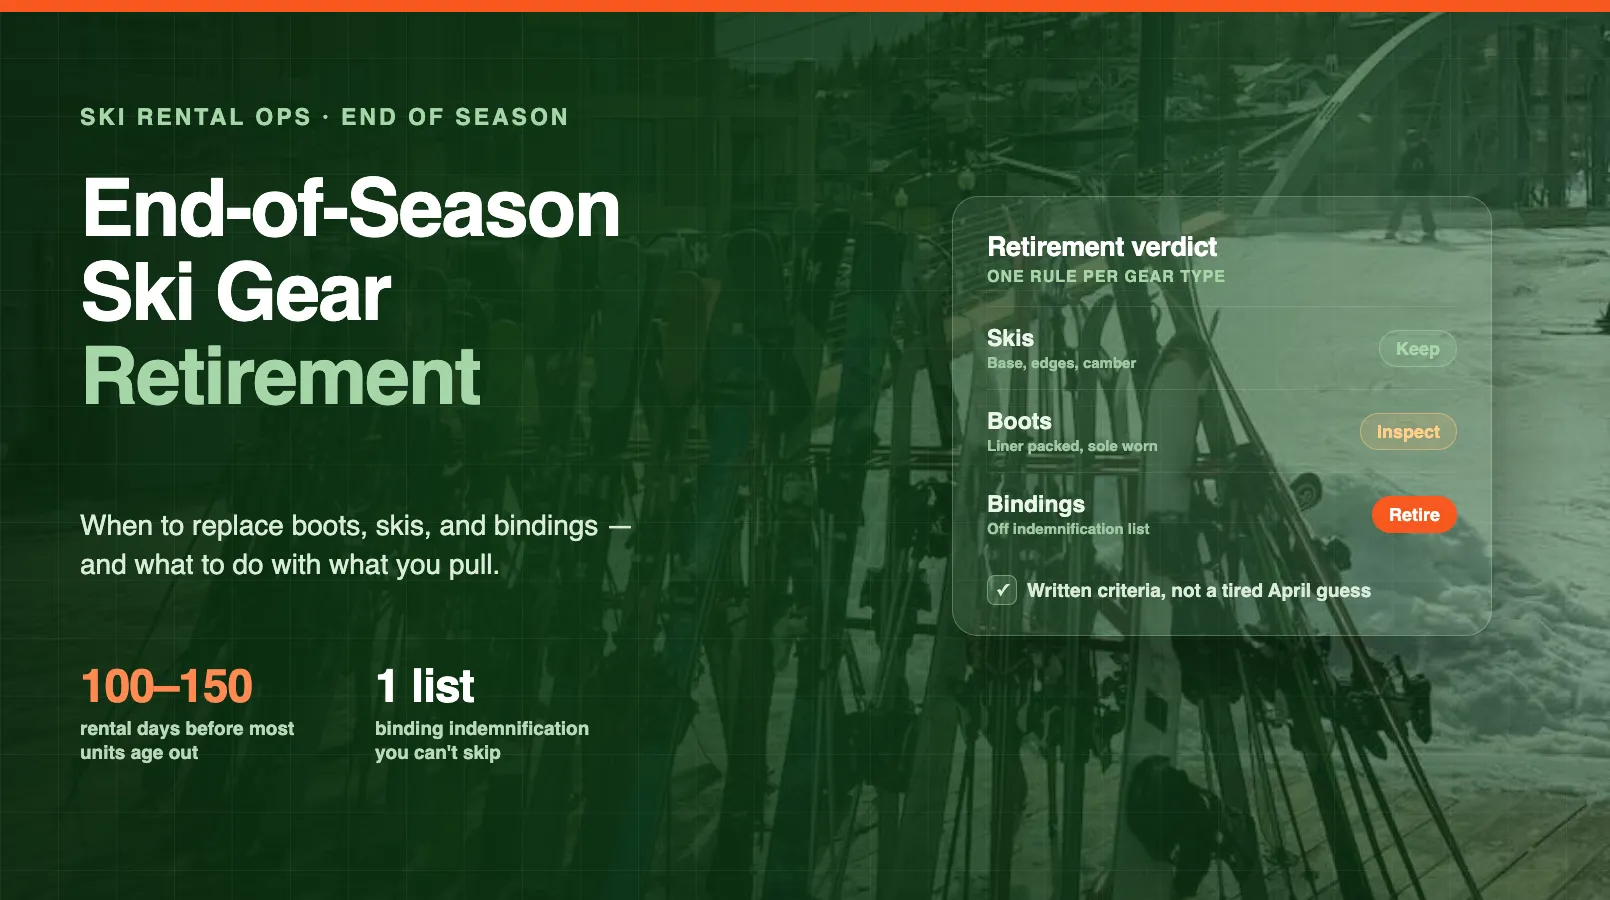
Post-season (wind-down planning):
- Flag equipment approaching end-of-life based on usage hours and maintenance history
- Recommend end-of-season sale pricing for units you plan to replace
- Generate next-season purchase recommendations: "Based on 2026 data, enter 2027 season with 14 single kayaks (up from 12), 6 tandems (down from 8), and 18 paddleboards (up from 15)"
The value of seasonal optimization compounds over years. The first season, your projections are based on limited data and general patterns. By season three, the system has granular data on your specific market -- how your customer mix behaves, which weather conditions drive demand in your area, and which equipment types trend up or down.
Integration with Your Existing Workflow
AI inventory management doesn't require starting from scratch. It layers onto the booking and operational data you're already generating.
What you need to get started:
- Digital booking records. If customers book through your website or a booking system, you have the core data. Each booking captures what was rented, when, for how long, and by whom.
- Equipment tracking by unit. Each kayak, bike, or board needs a unique ID. A barcode, asset tag, or even a numbering system ("Kayak-01" through "Kayak-15") is enough. Without per-unit tracking, you get category-level insights but miss the individual item analysis.
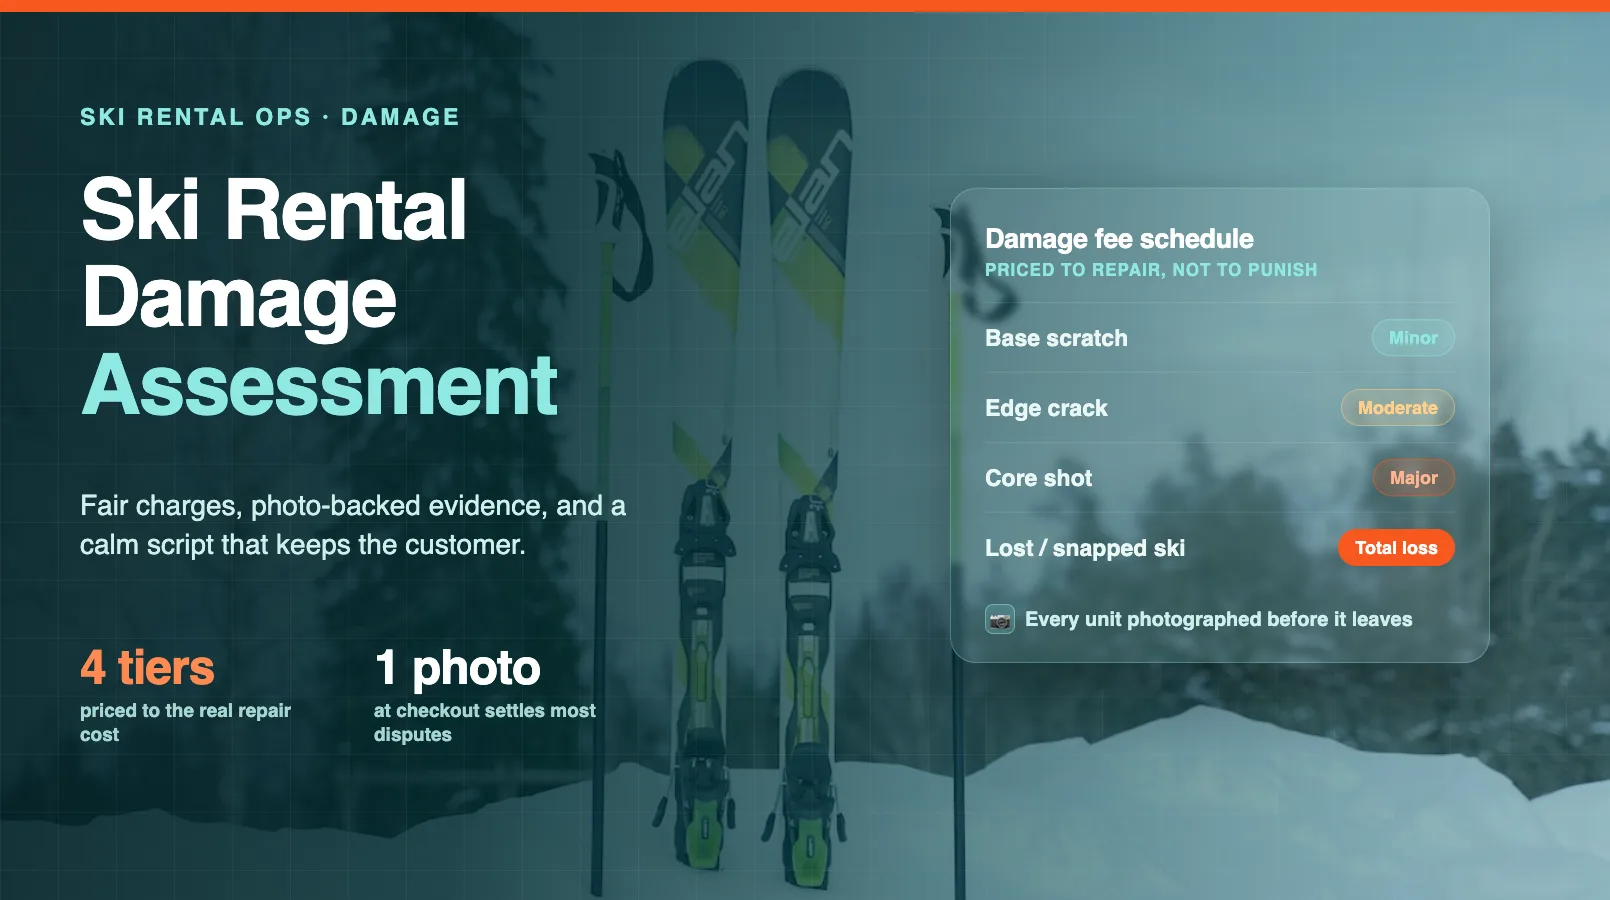
- Return condition logging. Even a basic "good / fair / needs attention" rating at check-in provides the data layer for maintenance predictions and equipment lifecycle tracking.
What you don't need:
- IoT sensors or GPS trackers (helpful but not required)
- A custom-built system (any modern rental management platform with API access works)
- Historical data going back years (one full season gives you a baseline)
The integration path most operators follow:
- Month 1: Connect booking system. Start seeing real-time inventory counts and basic utilization metrics.
- Month 2-3: Enough data accumulates for trend detection. Reorder alerts activate. Basic demand projections start appearing.
- Month 4+: Pattern recognition kicks in. Seasonal comparisons become available. Fleet optimization recommendations get more specific.
Dash AI connects directly to your booking calendar, inventory records, and maintenance logs. It starts generating utilization reports and reorder alerts within the first two weeks of connected data -- no configuration required beyond linking your existing systems.
The key is starting before peak season. If you activate AI inventory tracking in January for a June peak, you have five months of baseline data informing your busiest period. If you wait until June, you're learning on the fly during the weeks that matter most.
Smart inventory is one of 8 AI use cases rental operators are putting to work right now.
FAQ
How much historical data does AI inventory management need to be useful?
One full season gives you a solid baseline. The system starts providing value immediately with real-time inventory counts and basic utilization tracking. Predictive features -- demand forecasting, seasonal optimization -- improve significantly after 6-12 months of data. You don't need years of history to start.
Does AI inventory management work for small rental shops with under 50 items?
Yes. Smaller fleets actually benefit more from per-item tracking because each unit represents a larger percentage of your revenue. A 20-kayak operation losing one boat to untracked maintenance has 5% of its fleet offline. A 200-unit operation losing one boat barely notices. The utilization insights scale down well.
What's the difference between AI inventory management and a regular booking system with availability tracking?
A standard booking system shows what's available right now. AI inventory management projects what you'll need in 2-4 weeks, flags items approaching maintenance thresholds, identifies underperforming equipment, and adjusts reorder timing based on changing demand patterns. It's the difference between a rearview mirror and a windshield.
Can AI inventory management handle multi-location rental businesses?
Yes. Multi-location operations actually see the biggest gains because AI identifies imbalances between locations. If Location A has excess paddleboards while Location B is turning customers away, the system flags the transfer opportunity before you lose the booking.
How does seasonal demand prediction account for weather and local events?
AI cross-references your historical booking data with weather patterns, local event calendars, school holiday schedules, and early-booking trends. It doesn't predict weather months in advance -- it uses probabilistic models. "Based on the last three Julys and current early-season bookings, you'll need 15-18 paddleboards available on peak weekends."
What's a healthy fleet utilization rate for rental businesses?
Most operators target 55-70% utilization across their fleet. Below 50% means too much capital sitting idle. Above 80% means you're likely turning away customers during peak periods. The ideal rate varies by equipment type -- bikes might run higher utilization than specialty items like fishing kayaks.
Does this replace my current inventory spreadsheet entirely?
It replaces the manual tracking portion. You won't need to update stock counts, calculate utilization rates, or guess at reorder timing. Some operators keep a simplified spreadsheet as a backup during the transition, but most stop updating it within the first month once they trust the real-time data.
Rental inventory management used to be a memory game. You'd walk the rack, count what was there, and hope your mental math matched reality. AI doesn't make you smarter about your gear -- you already know your fleet. It makes you faster at spotting problems and more precise about planning ahead.
Start with real-time tracking and utilization metrics. That alone eliminates the double-booking and ghost-inventory problems that cost most shops thousands per season. The predictive features -- reorder alerts, seasonal optimization, demand forecasting -- layer on naturally as your data accumulates.
Your gear should be working for you, not sitting on a rack while customers drive to the competitor. AI inventory management makes sure you know the difference.
in one place