Fleet Utilization: Which Cars Are Earning and Which Are Just Parked
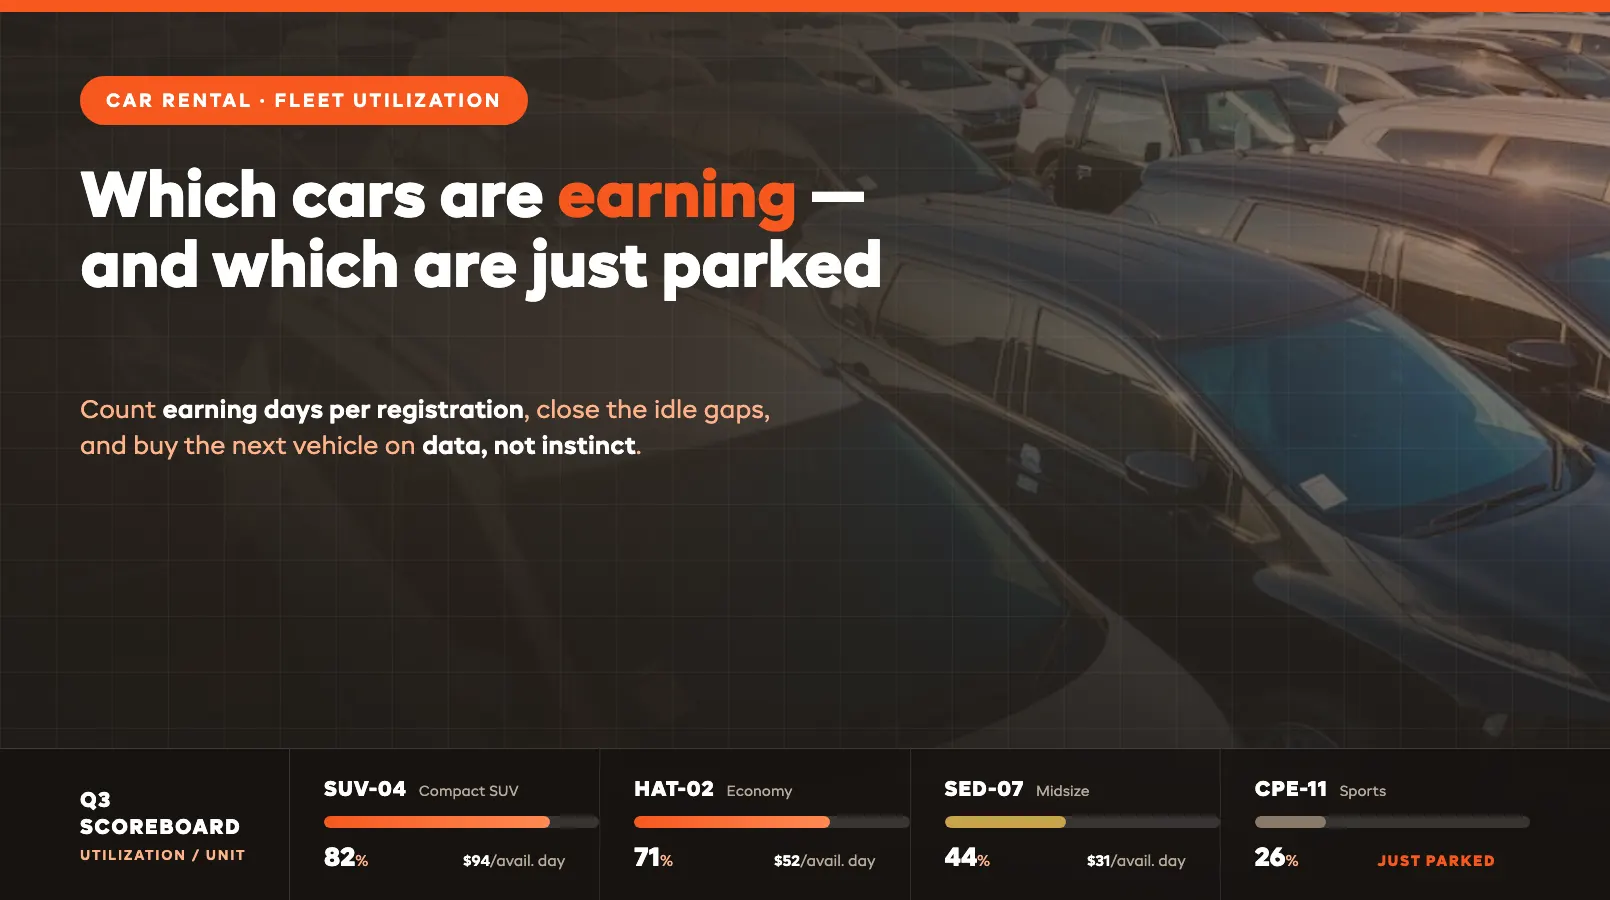
Ask a small fleet operator how business is going and the answer usually comes from the yard: "busy — cars are out all the time." Ask which specific registration earned the least last quarter and the room goes quiet. That gap is where margin hides. A busy yard and a profitable fleet are not the same thing, and the number that separates them is car rental fleet utilization — the share of available days each vehicle actually spends on hire.
The pattern repeats across almost every independent fleet: two or three vehicles run near-constant hires and quietly pay for the whole operation, while two or three others sit on the back row earning less per year than their insurance, depreciation, and parking cost to keep. Nobody decided to keep unprofitable cars. They just never counted per vehicle, because the counting is tedious when bookings live in a diary and revenue lives in a bank statement. The fix is the same one covered in our guide to software for independent car fleets: put every booking against a specific registration in one system, and the numbers fall out for free.
This guide walks through the six moves that turn utilization from a vague feeling into a management tool: measuring earning days per registration, compressing the idle gap between hires, structuring rates by duration, attaching margin-rich extras, treating servicing as a planned cost instead of a surprise, and, the payoff, buying your next vehicle on data instead of instinct.
Utilization Per Registration
Fleet-level utilization is a comfort number. "We ran at 70% this summer" sounds healthy and tells you almost nothing, because a fleet average is where weak vehicles hide. The number that changes decisions is per registration: for each car, the days it was on paid hire divided by the days it was available to rent, over a period long enough to smooth out noise — a month at minimum, a quarter for buying decisions.
The math is deliberately simple. A car available 90 days that spent 63 on hire ran at 70%. The same model parked next to it that managed 27 hire days ran at 30%. On a fleet average those two blur into "50%, fine." Side by side, they are a decision: one car deserves a twin, the other deserves a hard question.
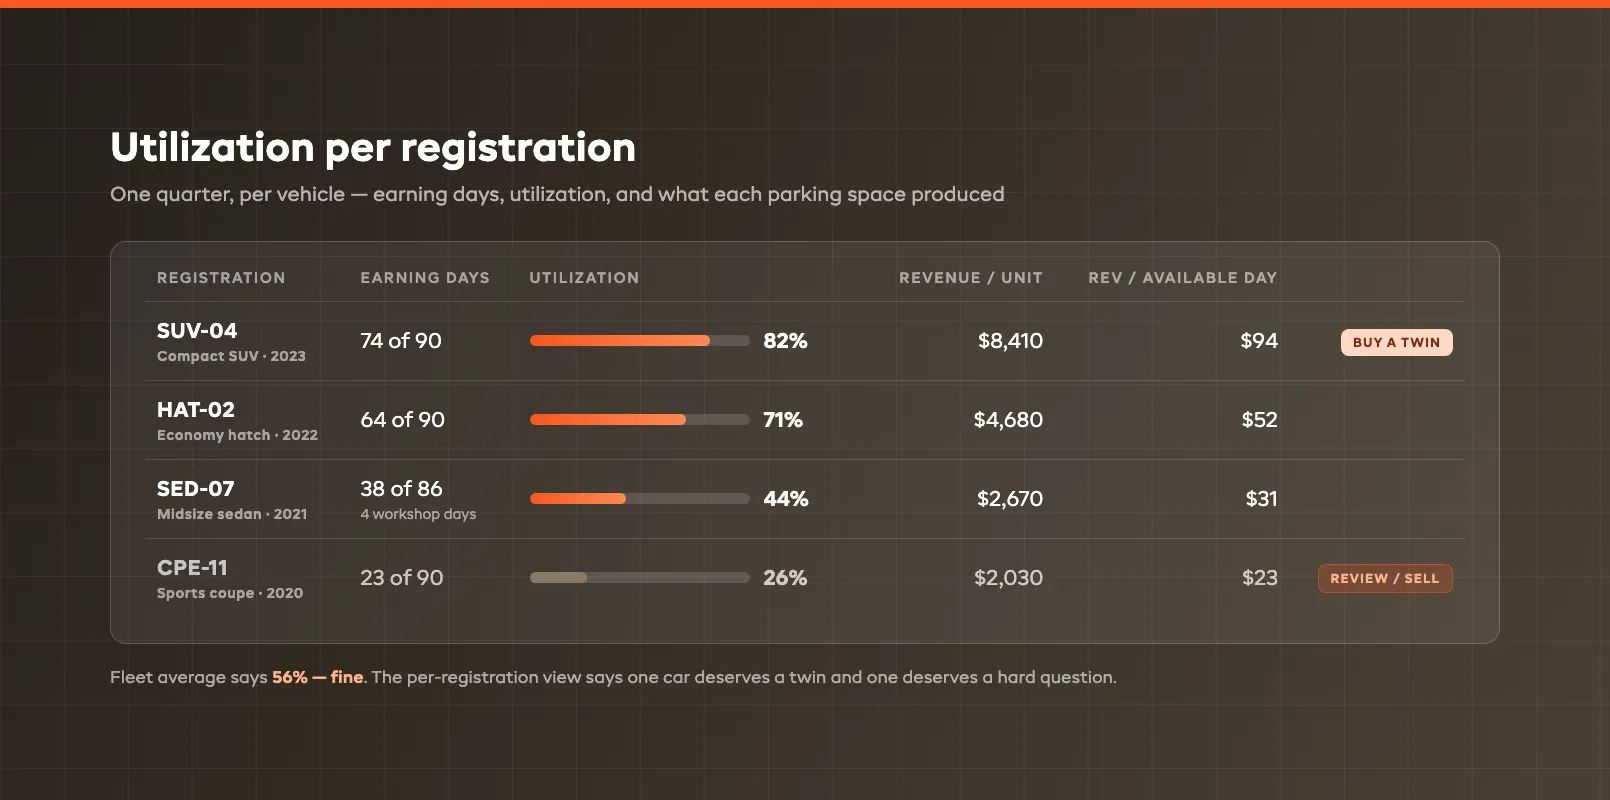
Pair the utilization figure with vehicle rental revenue per unit and the picture sharpens further, because high utilization at a weak rate is still a weak car. The scoreboard worth keeping has four columns per registration:
- Earning days: days on paid hire in the period
- Utilization: earning days as a share of available days (days in service, minus workshop days)
- Revenue per unit: total hire revenue plus extras attached to that registration
- Revenue per available day: the single best comparison number across different vehicle classes
That last metric matters because classes are not comparable on utilization alone. A luxury SUV at 45% utilization can out-earn an economy hatch at 80%, and often does. Revenue per available day puts them on one axis, so you compare what each parking space is actually producing.
Two rules make the numbers trustworthy. First, every booking must be assigned to a specific registration, not a vehicle class — "a compact" earning money tells you nothing about which compact. Second, count days out of service honestly. A car that spent ten days waiting on a part did not have those days available, and pretending it did flatters the fleet number while hiding a maintenance problem. A purpose-built car rental software platform records both automatically the moment bookings and workshop blocks go on the same per-registration calendar.
Turnaround Days as a Lever
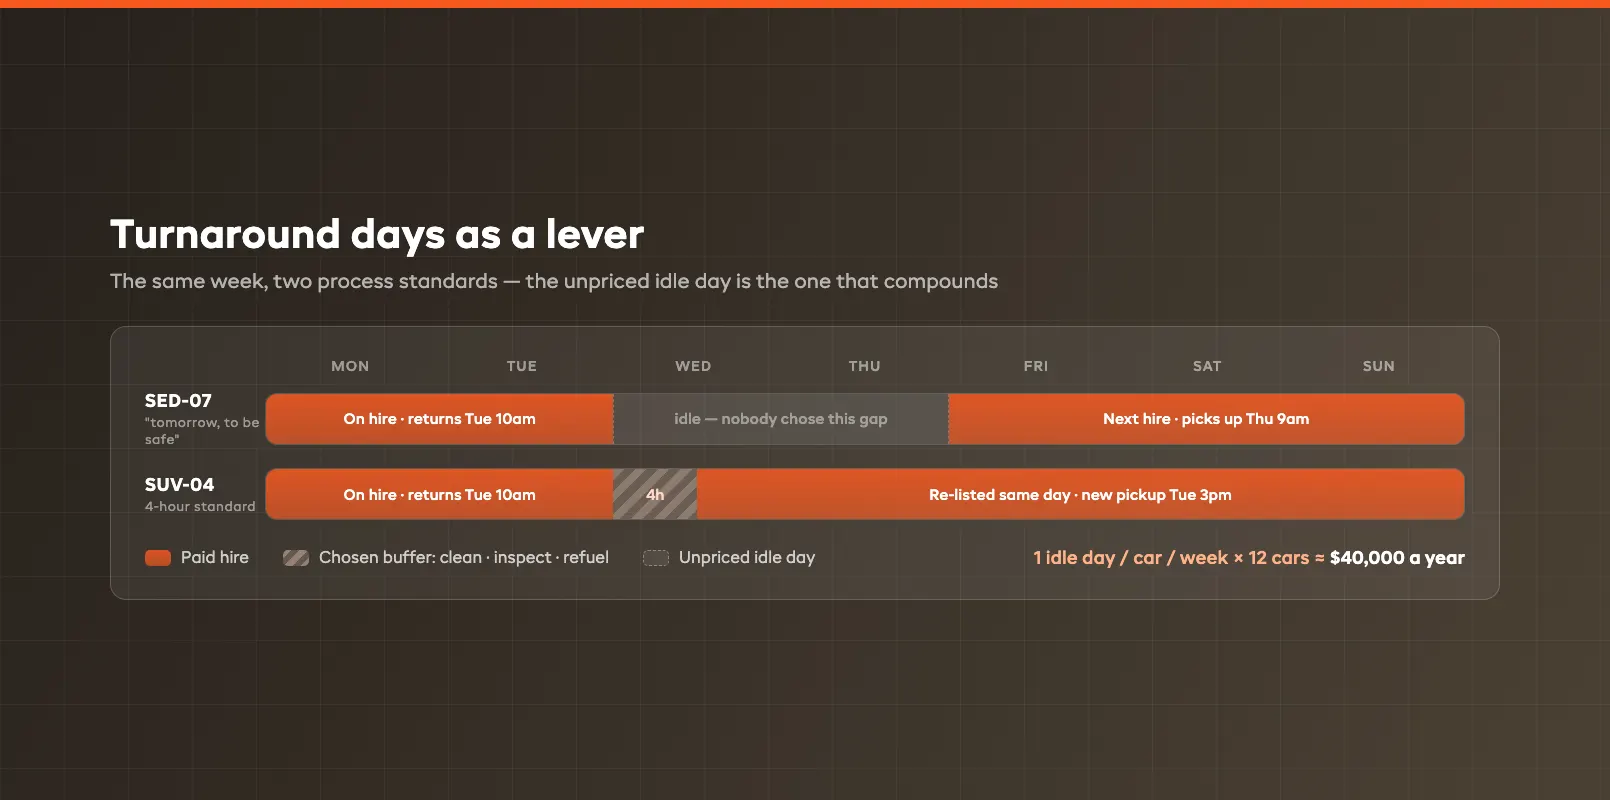
Here is the cost almost nobody prices: the day between a return and the next pickup. The car came back at 10 a.m. Tuesday, the next hire collects Thursday morning, and Wednesday just — happened. Nobody charged for it, nobody logged it, and at the end of the year those invisible single days add up to more lost revenue than any rate discount you agonized over.
Run the numbers on a modest fleet: twelve cars, each losing one avoidable idle day per week between hires, at an average $65 per day. That is $65 × 12 × 52: a little over $40,000 a year, roughly the entire annual revenue of two additional cars, gone without a single line item to show for it. Turnaround is not an operations detail. It is a lever with a five-figure handle.
Compressing it is mostly a scheduling and process problem:
- Measure the gap first. For each registration, log the hours between return and next pickup. Most operators guess "a few hours" and discover the median is over a day.
- Set a turnaround standard. Clean, inspect, refuel, and re-list in four working hours. That is achievable for a passenger car when the steps are a checklist instead of "when someone gets to it."
- Fold the inspection into the return. The return inspection you already run for damage (the one from our handover and damage evidence routine) produces the photos and readings anyway. Done at the return window with the customer present, it costs zero extra minutes of idle time.
- Let the booking calendar sell the gap. If your calendar shows a car free from Tuesday noon, the booking engine should be selling Tuesday-afternoon pickups, not holding the car until "tomorrow to be safe." Buffer time should be a deliberate setting per vehicle, not a habit.
The distinction to keep sharp: a buffer you chose (four hours for cleaning and inspection) is a cost of doing business. A gap nobody chose is pure leakage. The first shows up in your settings; the second only shows up when you measure per registration.
Rate Structures by Duration
A single daily rate is the simplest thing to put on a website and one of the quieter ways small fleets leak margin. The problem runs in both directions: a flat rate overcharges the month-long corporate hire into leaving for a competitor with weekly pricing, and undercharges the one-day weekend hire that consumes a full clean, inspection, and turnaround cycle for a single earning day.
Duration pricing fixes both ends. The shape that works for most independent fleets is a ladder:
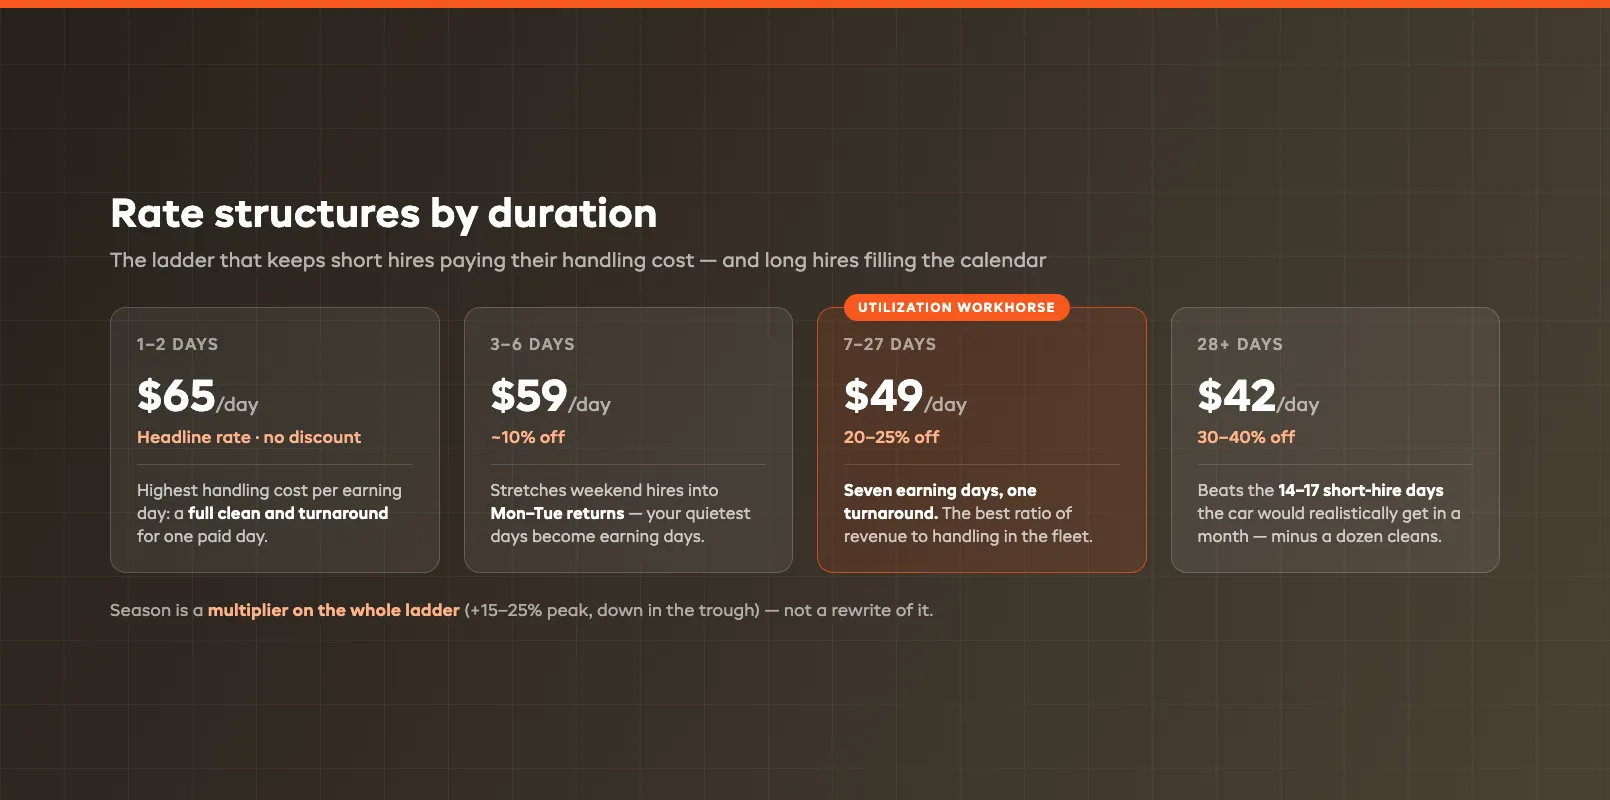
- 1–2 days: headline daily rate, no discount. Short hires carry the highest handling cost per earning day; they should carry the highest rate.
- 3–6 days: around 10% off the daily rate. This tier exists to stretch weekend hires into Monday or Tuesday returns, which converts your quietest pickup days into earning days.
- 7–27 days: 20–25% off. The weekly hire is the utilization workhorse: seven earning days, one turnaround.
- 28+ days: 30–40% off. A monthly hire at 60% of headline rate still out-earns the same car sitting at 50% utilization on daily hires, with a fraction of the cleaning, inspection, and counter time.
The discipline that makes a ladder work is anchoring it to utilization rather than sentiment. A long hire is not "money left on the table". It is guaranteed earning days with near-zero turnaround cost. The correct comparison for a 28-day hire at 65% of rate is not 28 days at full rate; it is the 14–17 hire days that car would realistically achieve on short bookings across the same month, plus a dozen cleans.
Season belongs on the ladder too, as a multiplier rather than a rewrite: peak weeks shift the whole ladder up 15–25%, deep off-season shifts it down to keep cars moving. When the rate table lives in your booking system rather than in your head, the quote is consistent whether the customer books online at midnight or calls at lunch, and midnight is when a meaningful share of them book.
Extras That Add Margin
The hire rate has a competitor standing next to it on every comparison site. The extras mostly do not, which is why a $12 child seat or a $15-per-day additional-driver fee carries better margin than the car itself. The vehicle earns $65 a day against depreciation, insurance, servicing, and cleaning. The child seat earns $12 against a one-time $60 purchase and a wipe-down.
The extras that reliably earn in small car fleets:
- Additional drivers: pure margin against a two-minute license capture
- Child and booster seats: legally required for the customers who need them, so attach rate is high when offered at booking
- GPS units and phone cradles: small, cheap, near-zero maintenance
- Excess reduction: the highest-margin line on the agreement; priced per day, sold in one sentence at checkout
- After-hours pickup or return: sells flexibility you already have, and fills the calendar edges your staffed hours leave empty
- Delivery to airport, hotel, or workplace: priced per trip, and often the reason the customer picked you over the airport counter
The operational rule: extras earn when they are offered at booking time, as checkboxes in the online flow, and quietly die when they depend on a counter upsell from whoever happens to be on shift. An operator who moves extras into the booking path typically sees attach rates triple, for zero extra effort at handover: the customer decided at midnight, unprompted, with no queue behind them.
For utilization math, book extras revenue against the registration that carried it. It flows into revenue per unit, and it changes buying decisions: the van class that looks mediocre on hire rate alone can turn out to be your best per-space earner once delivery fees and seat hire land on its ledger.
Servicing as a Planned Cost
Every fleet pays for servicing twice when it is unplanned: once for the work, and again in canceled bookings when the car is suddenly not where the calendar said it would be. The second cost is usually larger and never appears on an invoice. It appears as a refund, an apology, and a customer who books elsewhere next time.
Treating servicing as a planned cost means giving it the same status as a booking. It goes on the per-registration calendar in advance, it blocks availability so the booking engine cannot sell those days, and it gets scheduled for the weekdays and weeks when the car would probably have been parked anyway. An oil service scheduled for a quiet Tuesday costs you a day the car was statistically unlikely to earn. The same service forced by a dashboard warning on a summer Saturday costs a peak-rate booking and a scramble.
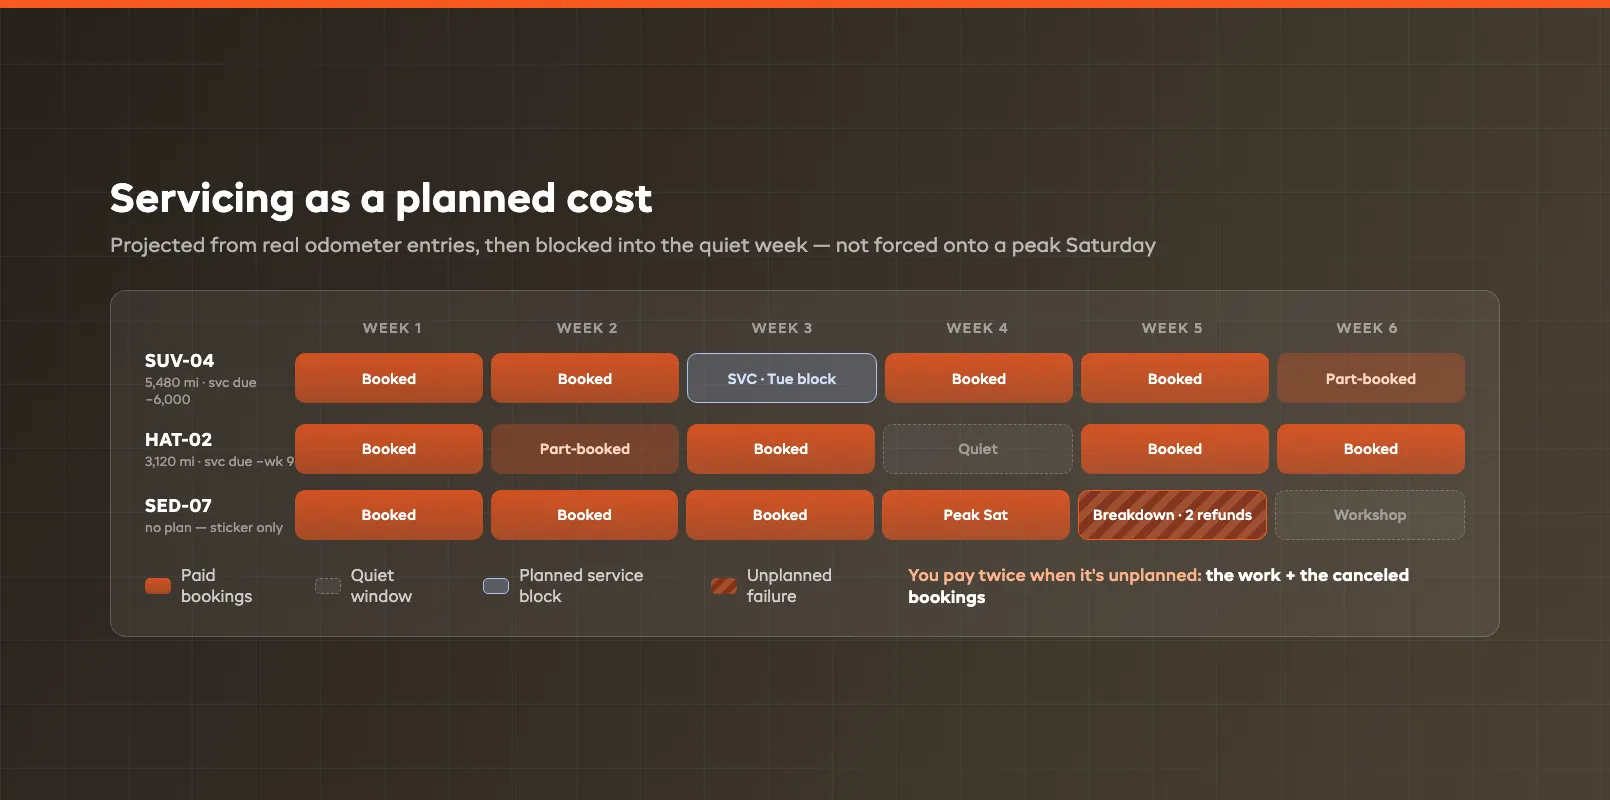
The mechanics are straightforward once mileage is captured at every handover and return — readings you are already recording as part of the damage routine:
- Set service intervals per registration by mileage and by date, whichever lands first.
- Project the due date from actual usage. A car doing 400 miles a week hits its 6,000-mile service in fifteen weeks; the system should be projecting that date continuously from real odometer entries, not waiting for the sticker in the windshield.
- Block the calendar the moment the projection lands in a quiet window, and let the block move if usage speeds up or slows down.
- Log workshop days as unavailable, so utilization stays honest and a car with a recurring fault shows up as exactly that in the quarterly numbers.
There is a reporting payoff on top of the operational one. When servicing, tires, and repairs are logged per registration, maintenance cost per unit becomes a real number you can set against revenue per unit. That pairing (what the car earns against what it costs to keep on the road) is the entire basis of the next section.
Buying the Next Vehicle on Data
Every vehicle purchase in a small fleet is a five-figure bet, and most of them are placed on instinct: what the operator likes driving, what the dealer had, what worked years ago. The quarterly scoreboard replaces the instinct with three questions the data answers directly.
Which class is oversubscribed? Look for the vehicles that spent the quarter above 75–80% utilization with search demand or turned-away bookings on top. That is unmet demand, and the strongest possible signal that a twin pays for itself. Your booking system's declined-dates and search logs tell you what customers wanted and could not get — demand that never appears in revenue reports because it never became a booking.
Which registration is underperforming its class? Two identical cars with a 20-point utilization gap is a listing problem, a photo problem, or a fault history, not a market signal. But a whole class sitting under 40% utilization and bottom of revenue per available day for two consecutive quarters is the market telling you something. Selling that car converts a parked asset into capital for the class that is turning customers away.
What does the margin ladder say? Rank every registration by revenue per available day minus maintenance cost per day. The top of that table is what your yard wants more of. The bottom is a candidates-for-sale list that requires no debate, because the argument already happened in the numbers.
The operators who run this loop (measure per registration, compress turnaround, price by duration, attach extras, plan servicing, then buy on the resulting numbers) compound the advantage every quarter. The ones who do not are still buying on instinct, and instinct has a documented tendency to buy another one of whatever is already parked on the back row.
None of it requires a data analyst. It requires every booking, extra, workshop day, and odometer reading landing against a registration in one system, and a report you glance at quarterly. That is a solved problem: EquipDash tracks per-unit earning days, revenue, and maintenance out of the box, with plans sized for a six-car yard as sensibly as a sixty-car one. The scoreboard builds itself while you run the hires, and the next vehicle you buy gets chosen by the cars that are earning, not the ones that are just parked.
FAQ
What is a good utilization rate for a small car rental fleet?
Most healthy independent fleets land between 60% and 80% per vehicle across a season. Below 50% for a full quarter, a car is usually not covering its ownership costs and belongs on the review list. Sustained readings above 85% sound ideal but usually mean you are turning demand away and under-maintaining — the signal to add a vehicle in that class, not to celebrate. Judge each registration against its class and season, never against the fleet average, because the average is where weak cars hide.
How do I calculate utilization per vehicle?
Divide days on paid hire by days available to rent, per registration, over at least a month. Days available means days in service: subtract workshop days and days genuinely off fleet, or the number flatters you. A car available 90 days with 63 hire days ran at 70%. Pair it with revenue per available day so a cheap busy car and an expensive occasional car can be compared on one axis. If every booking in your system is assigned to a specific registration, both numbers fall out automatically.
Why does turnaround time matter so much for fleet profitability?
Because idle days between hires are invisible and they compound. One avoidable idle day per car per week on a twelve-car fleet at $65 a day is over $40,000 a year, with no invoice, no line item, and nobody accountable. Cutting the typical return-to-ready gap from a day-plus to four working hours adds earning days without adding a single vehicle, which makes turnaround the cheapest capacity you will ever buy.
Should I discount weekly and monthly car hires?
Yes. Anchored to utilization, not sentiment. A weekly hire delivers seven earning days for one turnaround; a monthly hire at 60–70% of the headline daily rate still beats the 14–17 hire days that car would realistically achieve on short bookings in the same month, with a fraction of the cleaning and counter time. A ladder of roughly 10% off at 3–6 days, 20–25% off at 7–27 days, and 30–40% off at 28-plus days keeps short hires paying for their handling cost while long hires keep the calendar full.
How do I know which vehicle to buy next for my rental fleet?
Read the quarterly scoreboard before the dealer's lot. Classes running above 75–80% utilization with searches or bookings you had to decline justify a twin. Classes sitting under 40% utilization and bottom of revenue per available day for two consecutive quarters are sale candidates, freeing capital for what customers actually wanted. Rank every registration by revenue per available day minus maintenance cost per day: the top of the table is what to buy more of, and the bottom is the answer nobody has to argue about.
in one place