Equipment Utilization Tracking for Rental Shops
You bought 12 stand-up paddleboards last spring. Eight of them book every weekend. Two book once a month. The other two haven't left the rack since October.
Those last four boards still cost you money. Storage, insurance, depreciation — every unit in your fleet carries overhead whether it's rented or not. Utilization tracking is how you figure out which gear is earning its keep and which is dragging your margins down.
This guide covers the formula, the benchmarks, and the decisions utilization data should drive.
How to Calculate Equipment Utilization Rate
The formula is simple:
Utilization Rate = (Days Rented / Days Available) x 100
A surfboard available 30 days in a month that rented 21 of those days has a 70% utilization rate. A kayak available 30 days that booked 6 has 20%.
A few things to get right when running this calculation:
- "Days Available" excludes maintenance days. If a bike was in the workshop for 5 days, its available days are 25, not 30. Counting maintenance days as available will understate your true utilization.
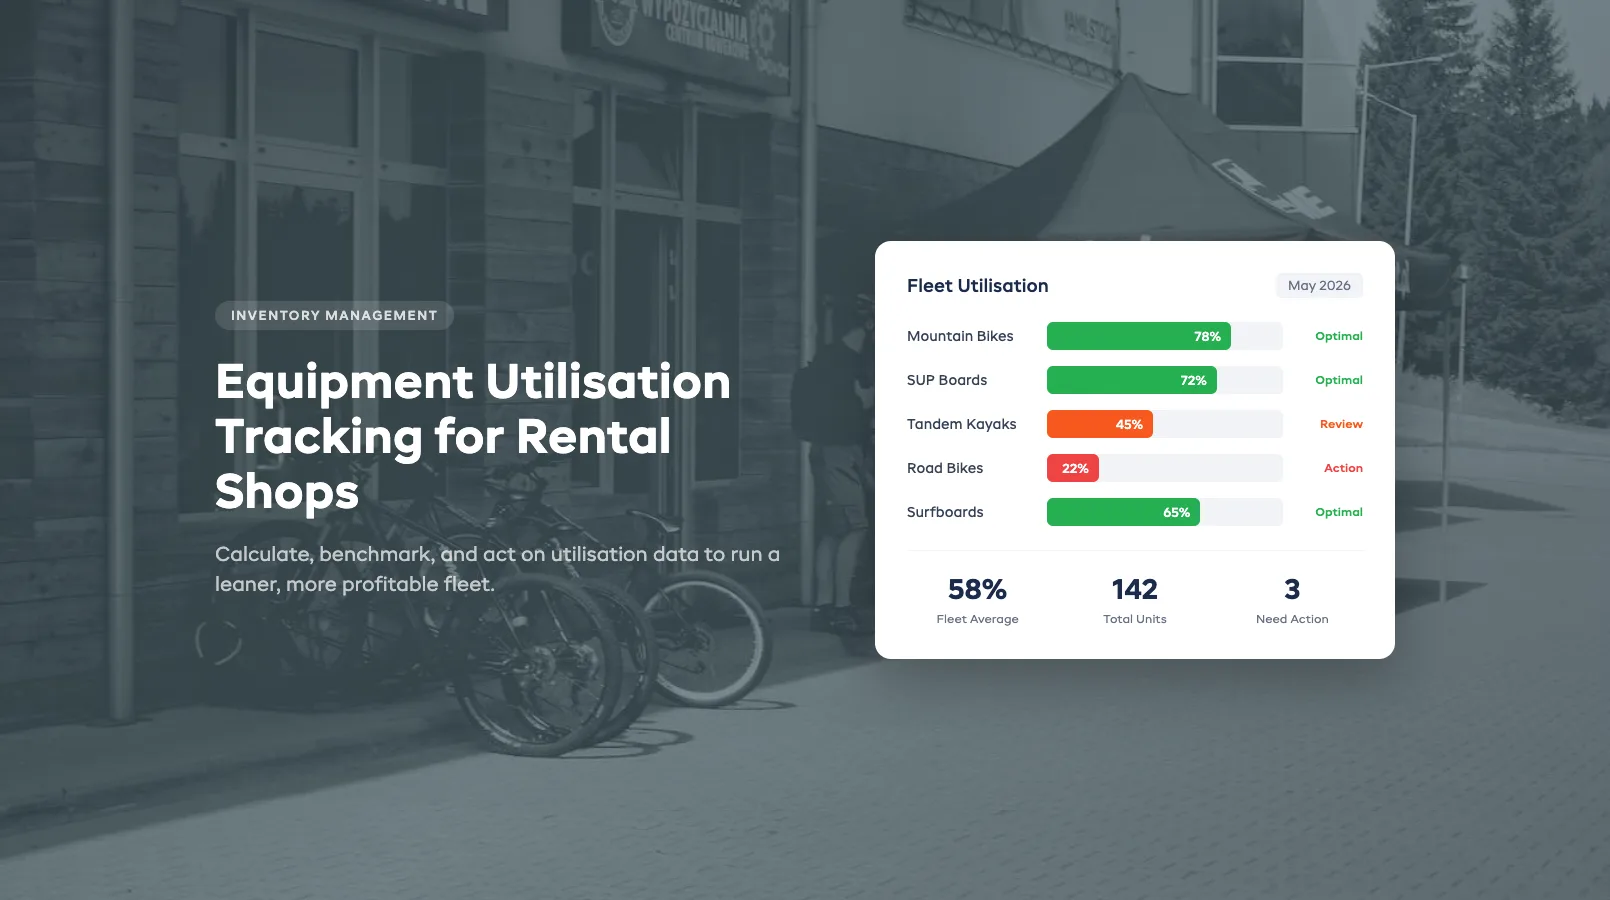
- Measure by category, not just fleet-wide. A fleet-wide average of 55% hides the fact that your mountain bikes run at 80% while your road bikes sit at 20%. Category-level data is where actionable decisions live.
- Pick a consistent time window. Monthly is standard for most shops. Weekly is too noisy. Quarterly smooths out seasonality but delays action.
If you're still running spreadsheets, this calculation is doable but tedious. A proper inventory management system pulls the numbers automatically from your booking data.
Benchmarks: What "Good" Looks Like
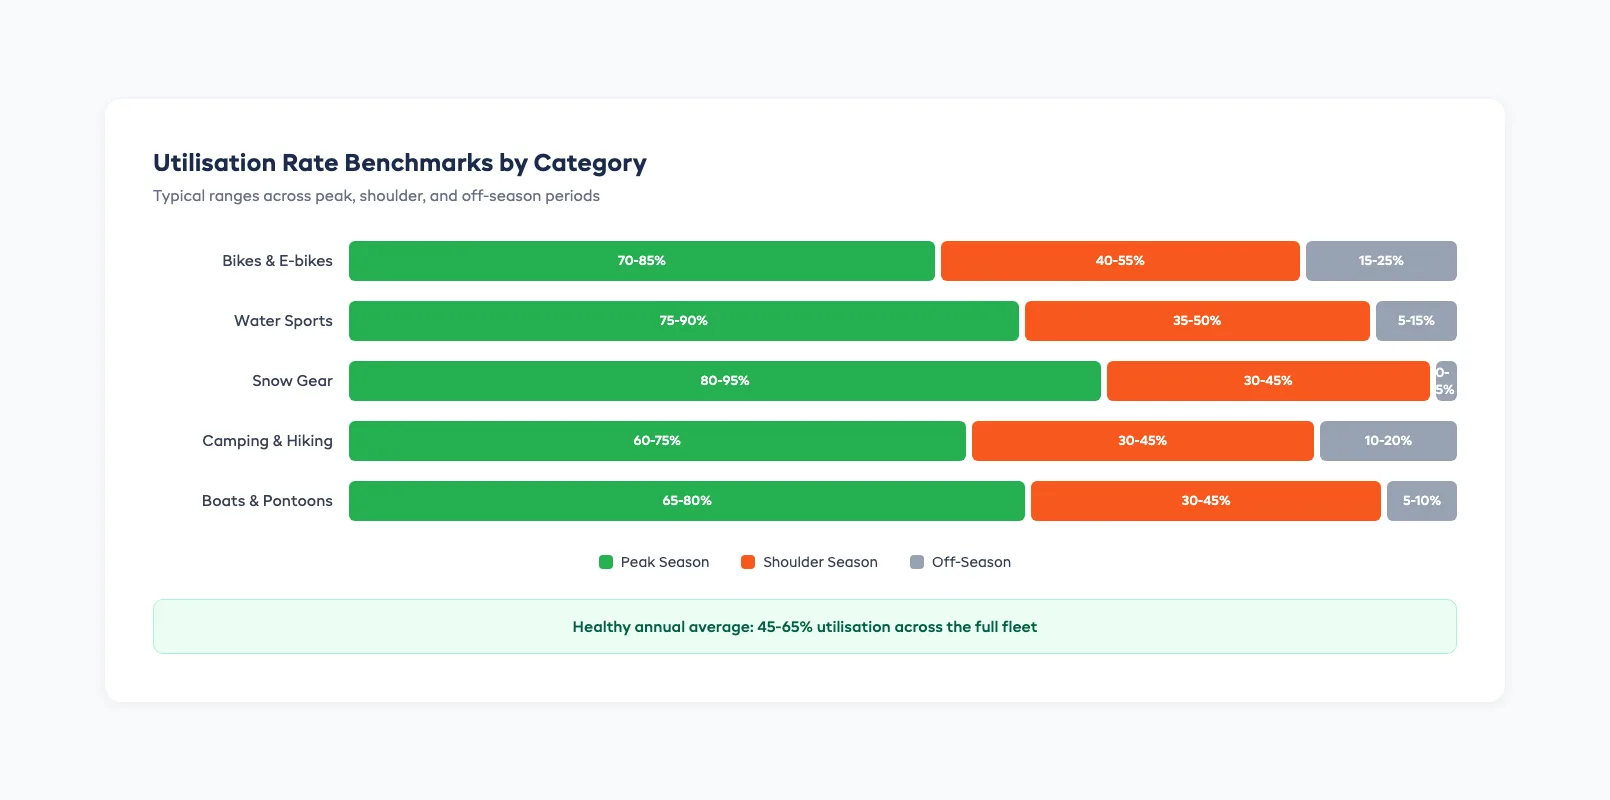
There's no universal "good" utilization rate. It depends on your gear type, location, and season. But here are working benchmarks from operators across different verticals:
| Category | Peak Season | Shoulder Season | Off-Season |
|---|---|---|---|
| Bikes & e-bikes | 70-85% | 40-55% | 15-25% |
| Water sports (SUP, kayak) | 75-90% | 35-50% | 5-15% |
| Snow gear (ski, snowboard) | 80-95% | 30-45% | 0-5% |
| Camping & hiking | 60-75% | 30-45% | 10-20% |
| Boats & pontoons | 65-80% | 30-45% | 5-10% |
A healthy annual average for most rental shops falls between 45-65%. Below 40% and you probably own too much gear, or the wrong gear. Above 75% year-round and you're likely turning away bookings. Both cost you money.
The goal isn't to maximize utilization. It's to optimize it. A fleet running at 95% has no buffer for walk-ins, last-minute bookings, or maintenance rotation. You want headroom.
Identifying Underperformers
Once you're tracking utilization by category and unit, patterns emerge fast. Here's what to look for:
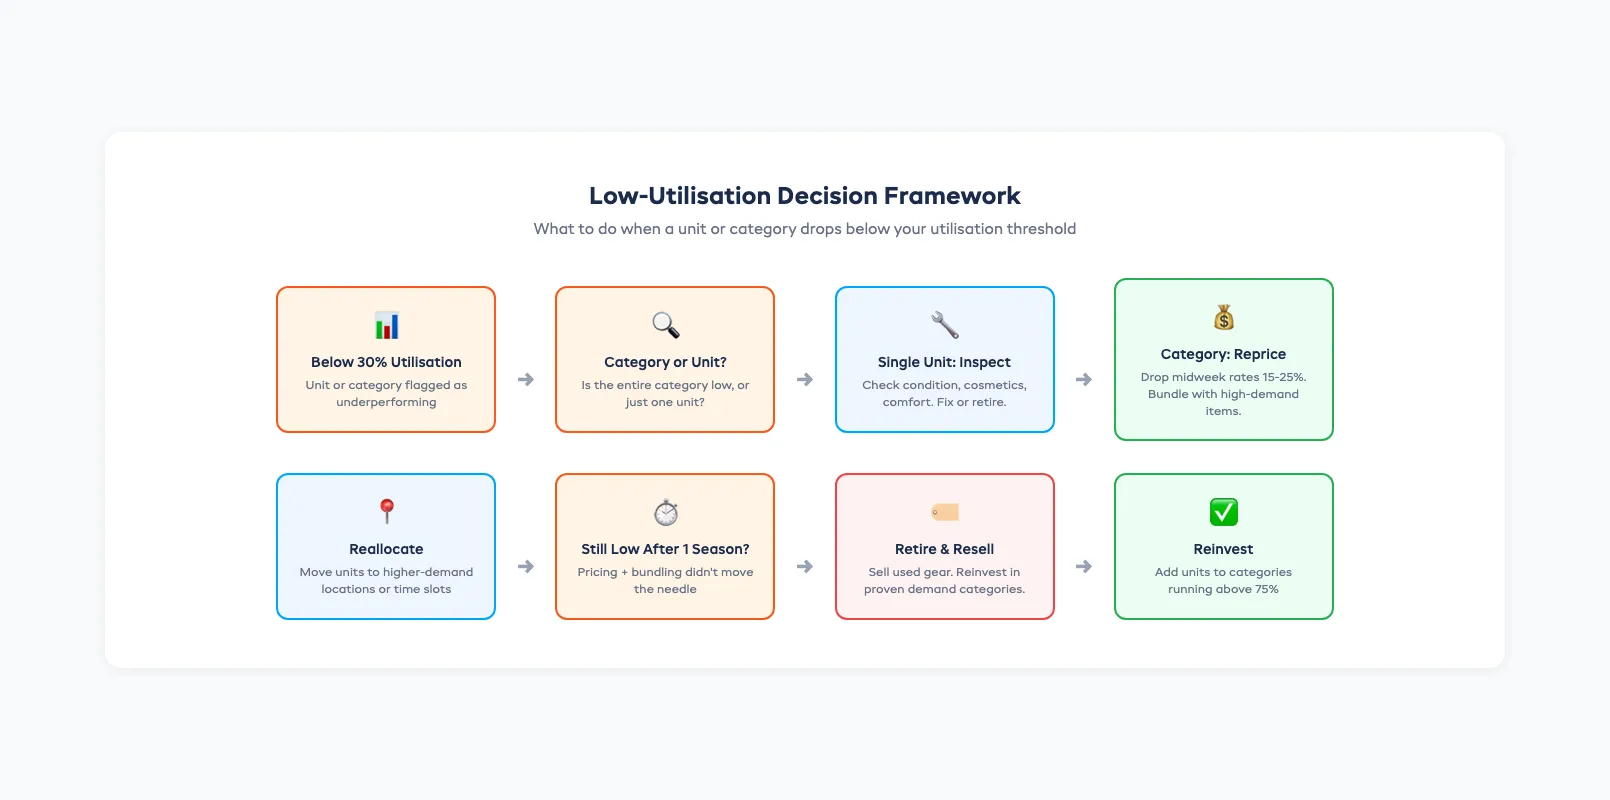
Category-level underperformers. If an entire category consistently sits below 30%, the problem isn't one bad unit. It's a demand issue. You either have too many units in that category or your market doesn't want what you're offering.
Individual outliers. One tandem kayak at 15% while the others run at 65%? That unit probably has a condition problem: cosmetic damage, an uncomfortable seat, a slow leak customers complain about. Pull it, inspect it, fix it or retire it.
Seasonal dead weight. Some gear only performs in a narrow window. That's fine if you planned for it. It's a problem if you bought 20 snowshoe sets expecting year-round demand in a three-month snow season. Track utilization by month to see exactly when each category earns and when it sits.
Location mismatches. If you run multiple locations, a surfboard sitting idle at your inland shop might book instantly at your beachfront location. Utilization data by location reveals reallocation opportunities you'd otherwise miss.
The key is reviewing this data regularly — monthly at minimum. Waiting until end-of-season to check means you've already absorbed months of carrying costs on gear that wasn't earning.
Levers: Pricing, Bundling, and Retirement
Low utilization isn't always a "sell it" problem. You have several levers before retirement:
Dynamic pricing. Drop midweek rates on underperforming categories by 15-25%. A paddleboard renting at $30/day on a Tuesday is better than one sitting on the rack at $50. Even modest discounts can push utilization from 30% to 50% on slow days.
Bundling. Package low-utilization gear with high-demand items. If your tandem kayaks fly but your single kayaks don't, create a "group paddle package" that includes both. Customers get a deal. You move idle inventory.
Seasonal rotation. Swap slow-season gear out of your active fleet. Store it properly, reduce insurance coverage where possible, and free up rack space for categories that actually book. This is especially relevant for shops that track equipment across seasons.
Retirement and resale. When a unit has been underperforming for two or more seasons, and pricing and bundling haven't helped, it's time to sell. Holding dead stock also increases your risk of double-booking issues when customers see "available" units that aren't actually rent-ready. Used rental gear sells well on marketplace platforms, especially early in the season when recreational buyers are shopping. Recover what you can and reinvest in categories with proven demand.
Reallocation. Before retiring a unit, check whether it would perform better somewhere else. A different location, a different rental duration (hourly vs full-day), or a different customer segment might unlock demand you weren't capturing.
Tracking Utilization in Your Software
Spreadsheets work for small fleets — maybe 20-30 units. If you're still on paper, our equipment sign-out sheet template captures the checkout data you need, but calculating utilization from paper records is a manual headache. Beyond 20-30 units, the effort of logging every checkout and calculating rates by category, unit, and time period becomes a second job. That's where purpose-built rental software earns its keep.
What to look for in a utilization tracking tool:
- Automatic calculation from booking data, no manual entry
- Category and unit-level breakdowns so you can drill from fleet-wide averages into individual performance
- Date-range filtering to compare peak vs off-season, this year vs last
- Alerts for underperformers: flags when a unit drops below a threshold you set
- Maintenance day exclusion so your numbers reflect true availability
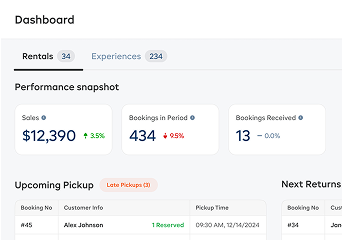
Dash builds utilization reports directly from your booking history. Filter by product category, date range, or individual unit. Set a utilization threshold and get flagged when something drops below it, so you're acting on data instead of guessing at the end of the season.
The operators who track utilization consistently make better purchasing decisions, retire gear at the right time, and run leaner fleets with higher margins. The ones who don't end up with racks full of equipment that looks busy but isn't earning.
FAQ
What is a good equipment utilization rate for a rental business?
A healthy annual average falls between 45-65% for most rental shops. Peak-season rates of 70-90% are normal depending on gear type. Above 75% year-round means you're likely turning away bookings. Below 40% suggests you own too much gear or the wrong mix.
How do I calculate equipment utilization rate?
Utilization Rate = (Days Rented / Days Available) x 100. Exclude maintenance days from "Days Available" to get an accurate picture. Measure by category and individual unit, not just fleet-wide averages.
How often should I review utilization data?
Monthly is the sweet spot for most operators. Weekly data is too noisy for meaningful trends. Quarterly reviews smooth out seasonality but delay action on underperforming items. Set a calendar reminder for the first week of each month.
Should I sell equipment with low utilization or adjust pricing first?
Try pricing and bundling first. A 15-25% midweek discount or a bundle with high-demand gear can significantly lift utilization. If a unit has underperformed for two or more seasons despite adjustments, sell it and reinvest in categories with proven demand.
Can I track utilization in a spreadsheet?
Spreadsheets work for small fleets of 20-30 units. Beyond that, manually logging checkouts and calculating rates by category, unit, and time period becomes unsustainable. Rental software that calculates utilization automatically from booking data saves significant time and reduces errors.
What causes low utilization despite high demand?
Common causes include condition issues customers notice (cosmetic damage, worn components), poor location placement, pricing that's too high for the category, or booking friction that sends customers to competitors. Check unit-level data to isolate whether it's a fleet-wide or individual problem.
How does utilization tracking connect to fleet management?
Utilization is the core metric in fleet management. It drives right-sizing decisions (how many units to own), replacement timing (when to retire gear), and allocation choices (where to place units across locations). Without utilization data, fleet decisions are guesswork.
in one place